
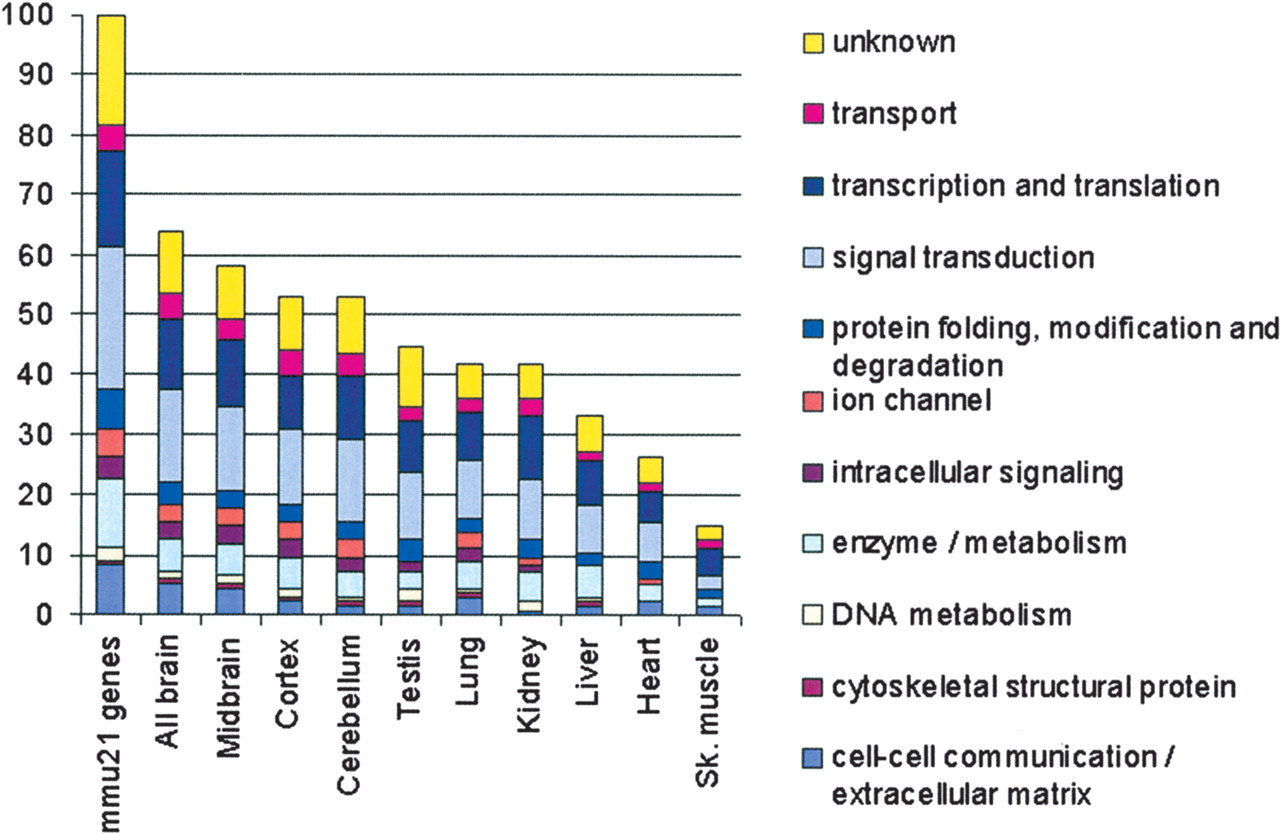
Figure 2
Functional distribution of the 136 mmu21 genes in nine tissues of euploid mice. The 136 Chr21 orthologs (mmu21) were distributed into 10 categories of biological processes (left bar; Hill et al. 2002). Bars show the functional distribution of the genes expressed in each tissue, as percent of the total number of mmu21 genes. The second left bar (all brain) represents the accumulated data from the three brain regions.


