
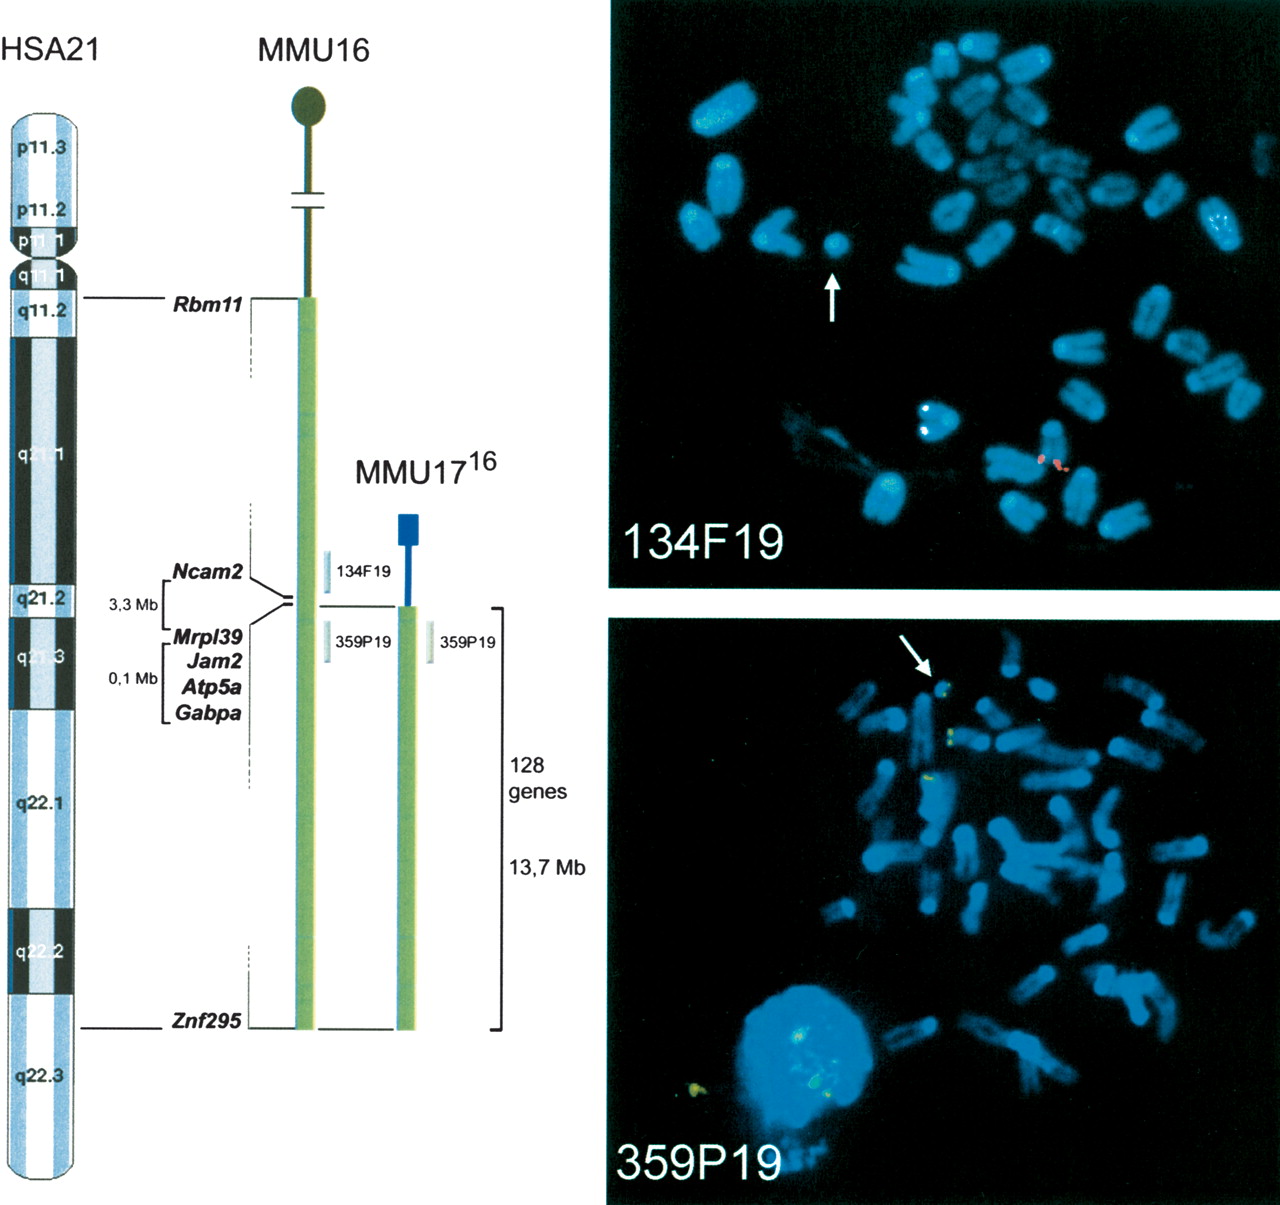
Figure 1
Boundaries of the proximal T(16;17)65Dn breakpoint were determined by FISH. Left: Schematic illustrating the synteny between HSA21 and MMU16, and the translocation chromosome MMU1716 with the genes at the boundaries of the triplicated segment. Chromosomal position of the two BACs used for the FISH analysis is indicated. Right: Metaphase spreads from T(16;17)65Dn mouse; BAC 134F19 (top) is in red and BAC 359P19 (bottom) is in green. Arrows point to the MMU1716 chromosome.


