
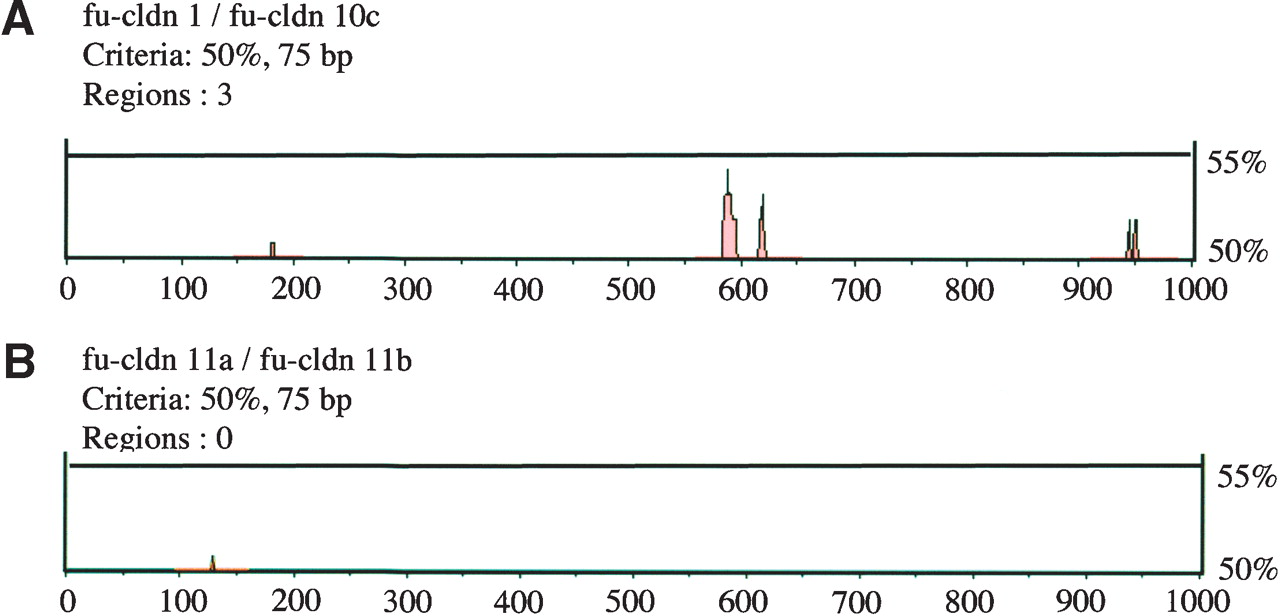
Figure 6
Promoter region analysis for two pairs of Fugu claudin genes with either similar (A) or distinct (B) tissue distributions. The 5′-noncoding regions of two claudin genes with a similar (cldn1 and cldn10c; Table 2) or different (cldn11a and cldn11b; Table 2) expression profile were analyzed. Red areas show regions along the 5′-noncoding sequence that share a homology of 50% or more.


