
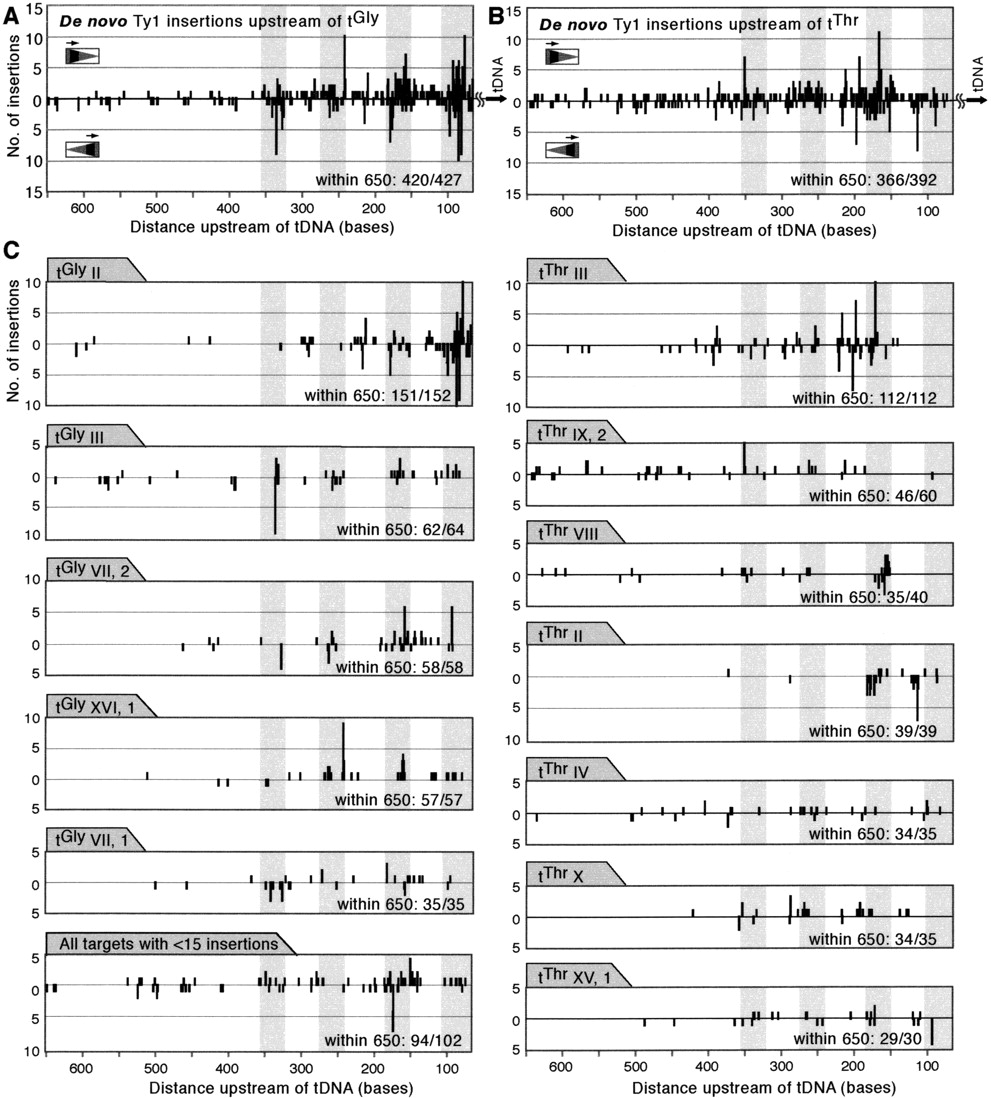
Figure 5
Distribution of de novo insertions within 650 bases upstream of the TSSs of tGly and tThr gene families and individual preferred tDNAs. (A) Insertions upstream of the tGly family. (B) Insertions upstream of the tThr family. (C) Insertions upstream of individual tDNAs that received more than 15 insertion events. (Bottom, left) Composite of insertions upstream of all tDNA targets that received 15 or less insertion events. Insertions are plotted as described in the legend to Figure 4. Gray bars highlight the 36 bases (18 bases on each side) around each integration peak (–85, –170, –265, and –335).


