
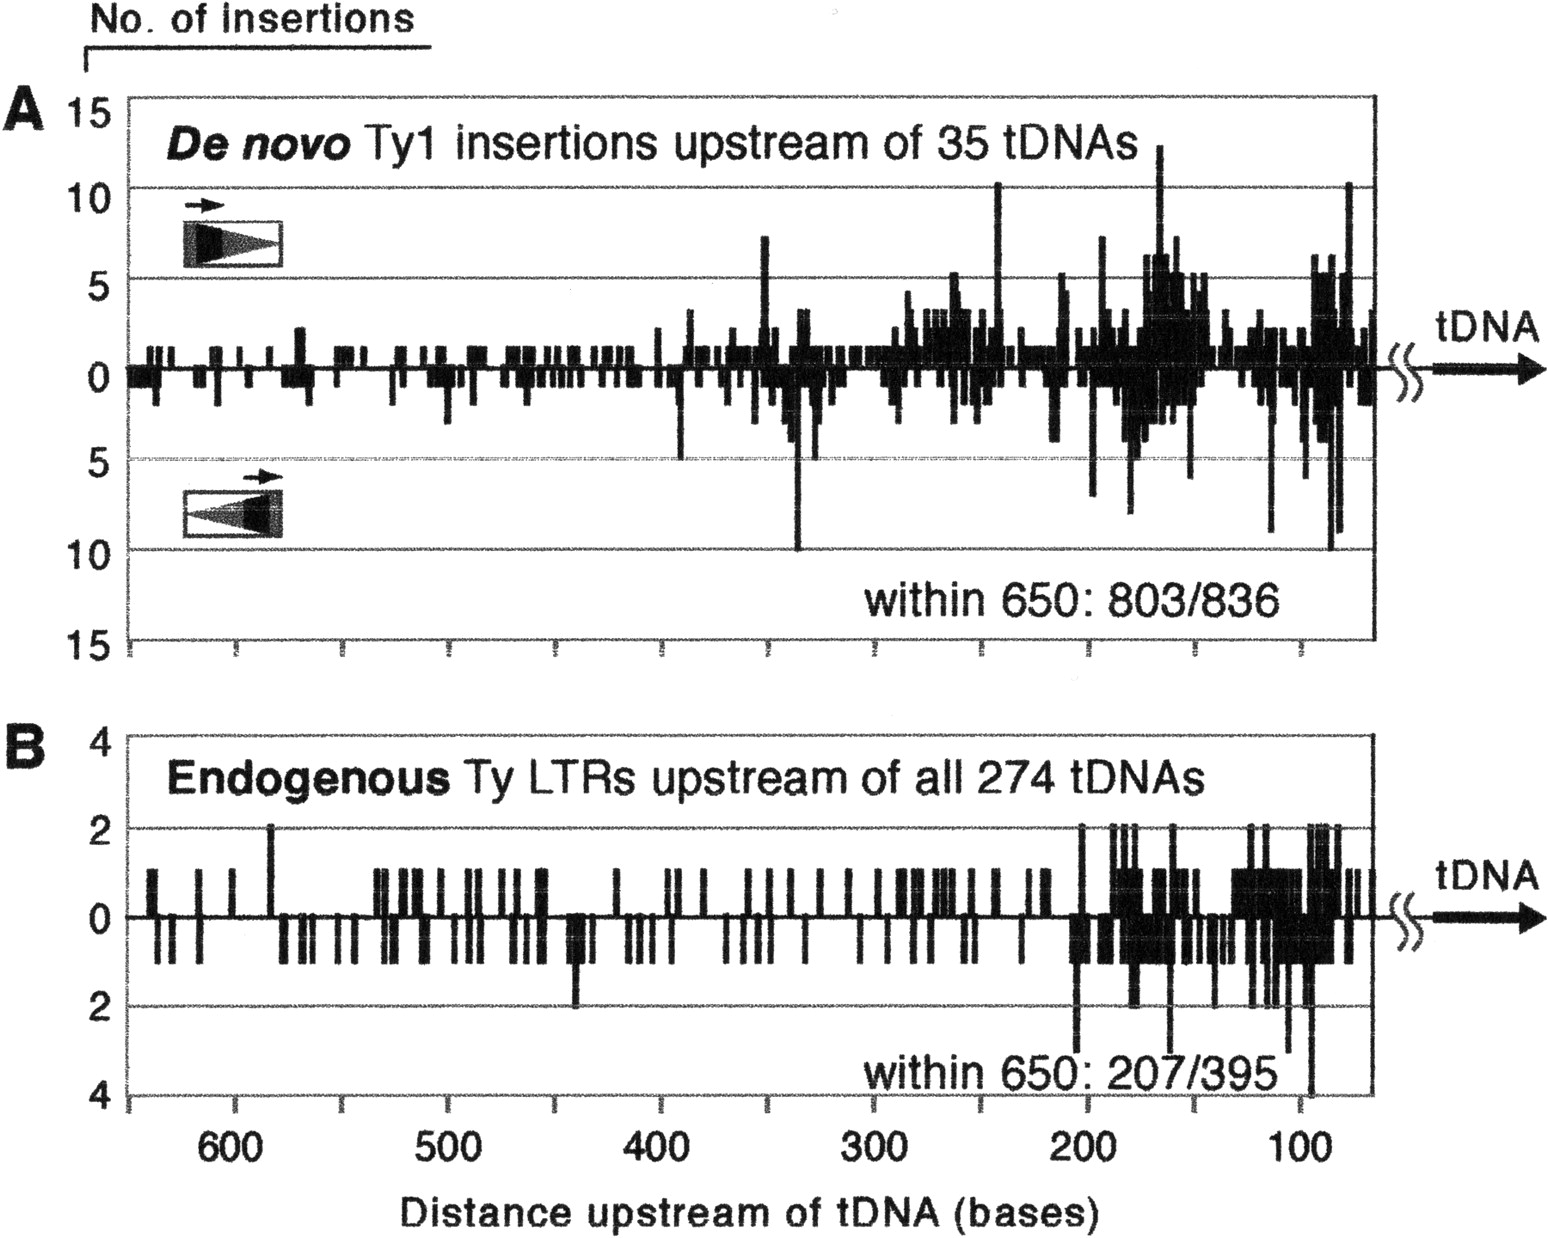
Distribution of de novo Ty1 insertions and endogenous Ty retrotransposon sequences upstream of tDNA targets in the yeast genome. (A) Composite diagram of all sequenced de novo insertion events within 650 bases upstream of the TSS of 35 different genomic tDNAs (n = 803). Each line represents insertion events into a single base position. The frequency of insertion events into a position is shown vs. the distance upstream of the tDNA target. Insertions begin 65 bases upstream of the tDNA, shown at the far right, and distance increases leftward across the x-axis. Ty1 insertions amplified using the orientation 1 primer are shown above the x-axis; those amplified with the orientation 2 primer are shown below the line. (B) Position of endogenous Ty1, Ty2, and Ty4 LTRs in the yeast genome upstream of the mature 5′ processed end of the tDNA target.


