
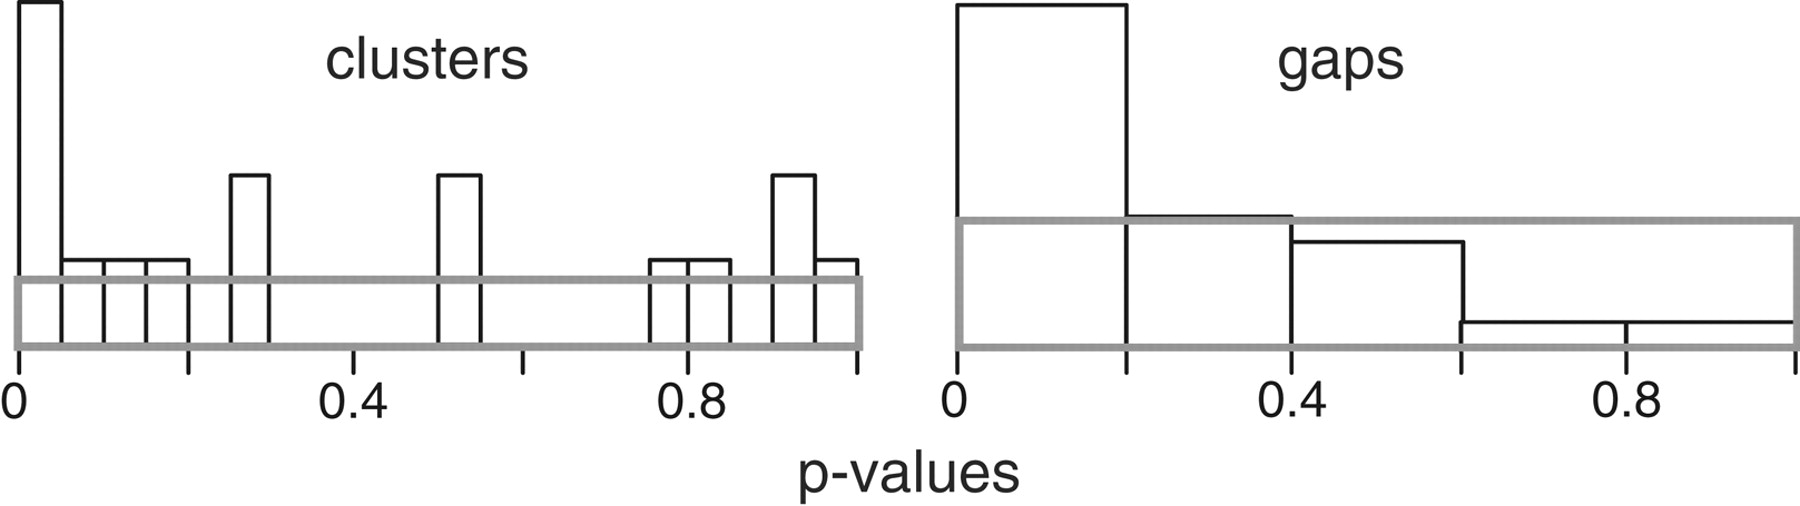
Figure 7
Distribution of P values. The uncorrected P values for the minimal k-span (k = 6) and maximal gap size for all chromosomes are shown. Similar results were found for k = 7 and 8 (not shown). The rectangles show the expected distribution of P values for a random uniform insertion of inserts.


