
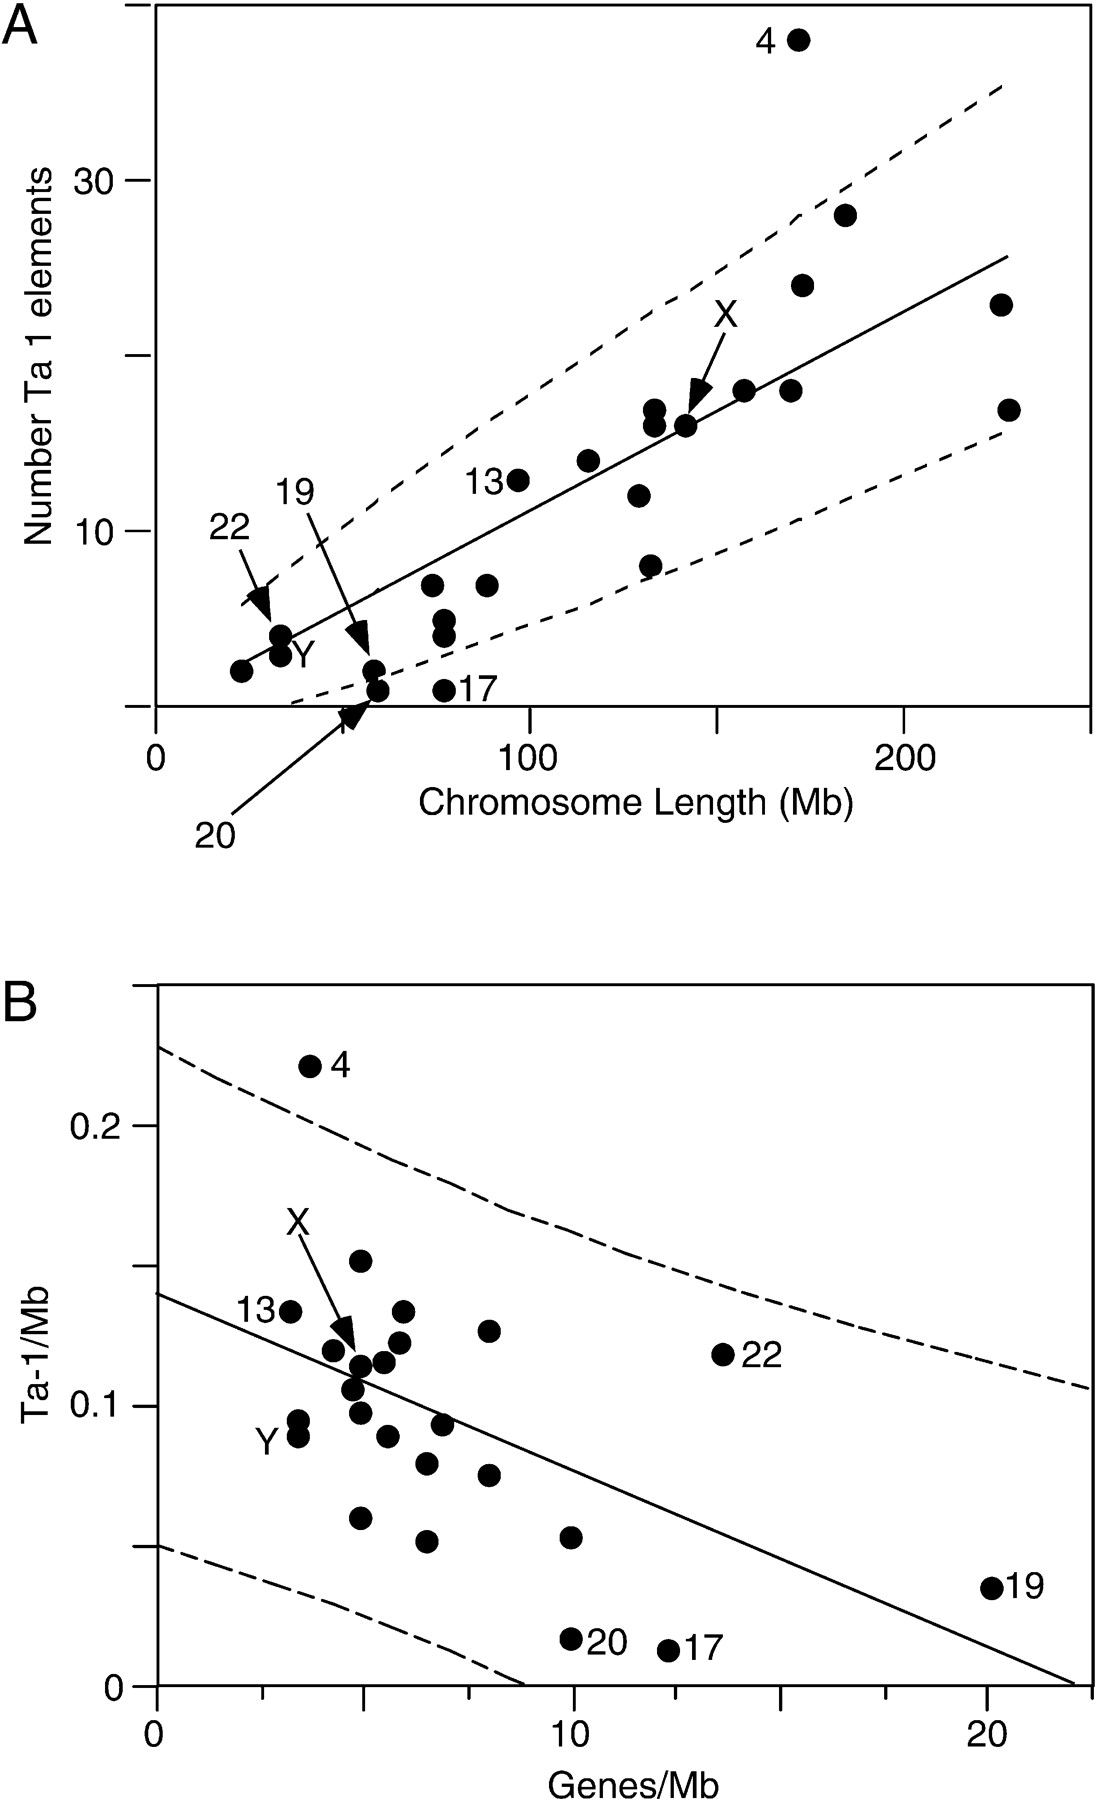
Figure 6
Chromosomal distribution of Ta-1 elements. (A) The number of Ta-1 elements per chromosome is positively correlated to the chromosome physical length (P < 0.0001) in megabases (Mb, gaps removed). The solid line corresponds to the line expected if Ta-1 elements are distributed proportionally to the length of the chromosomes. The 95% confidence limits (dashed lines) are calculated as ±1.96 times the square root of the predicted number of sites to account for Poisson counting error. (B) The number of Ta-1 elements per chromosome (Ta-1/Mb) is negatively correlated to the gene density (Genes/Mb); R = –0.49, P < 0.004.


