
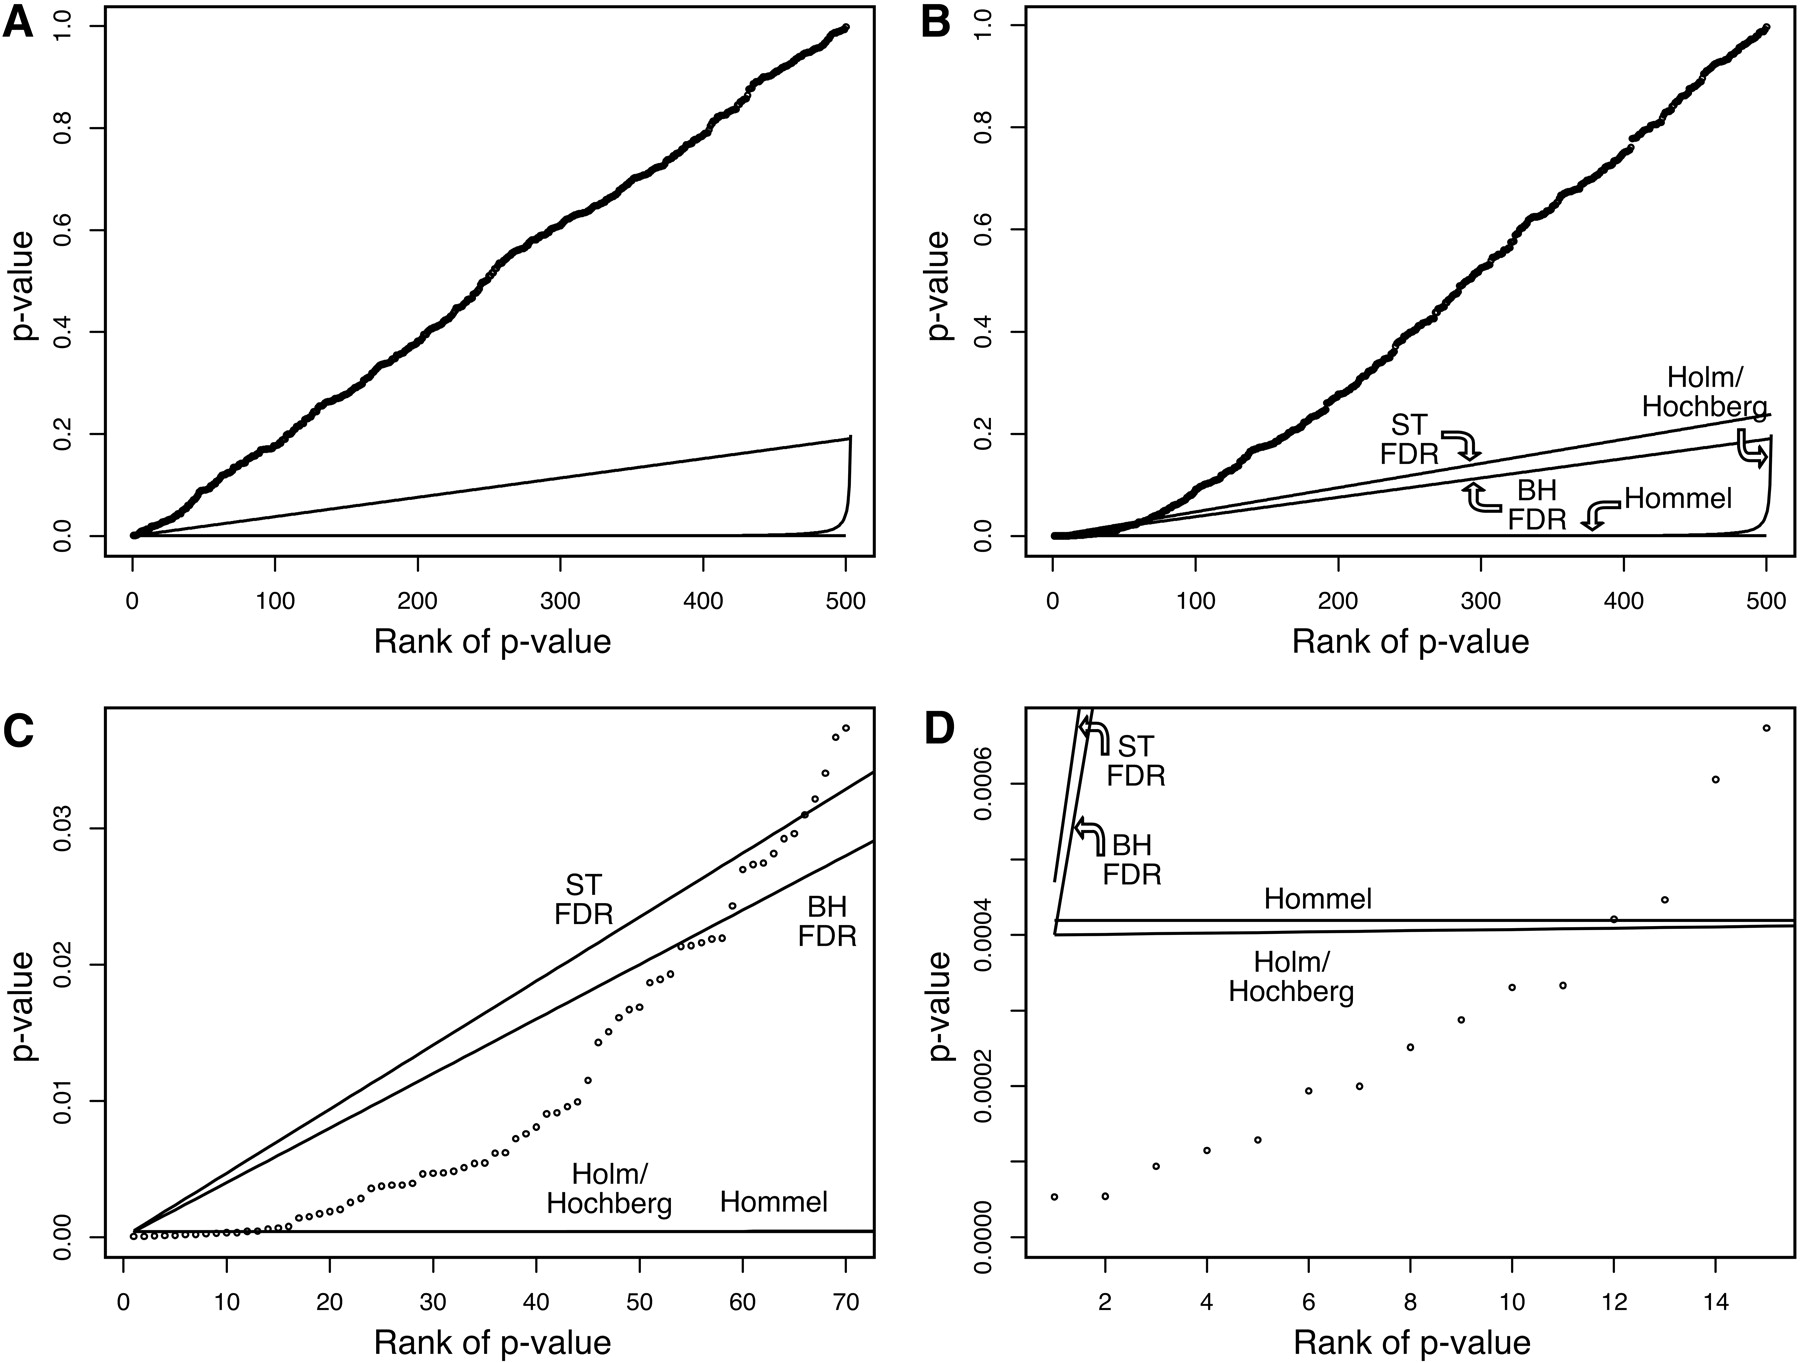
Figure 2
Comparison of multiple-test methods. (A) p-values from family of tests in which all null hypotheses are true. The Benjamini and Hochberg and Storey and Tibshirani thresholds for FDR control at 20% coincide and are represented by the line with positive slope. The Holm/Hochberg significance threshold for FWER control begins below and then rises dramatically above the Hommel threshold for FWER control at 20% (difference only discernable on the far right of the plot). (B) p-values from a family of tests in which 80 null hypotheses are false; (C) data from B at expanded scale; (D) data from B and C at expanded scale.


