
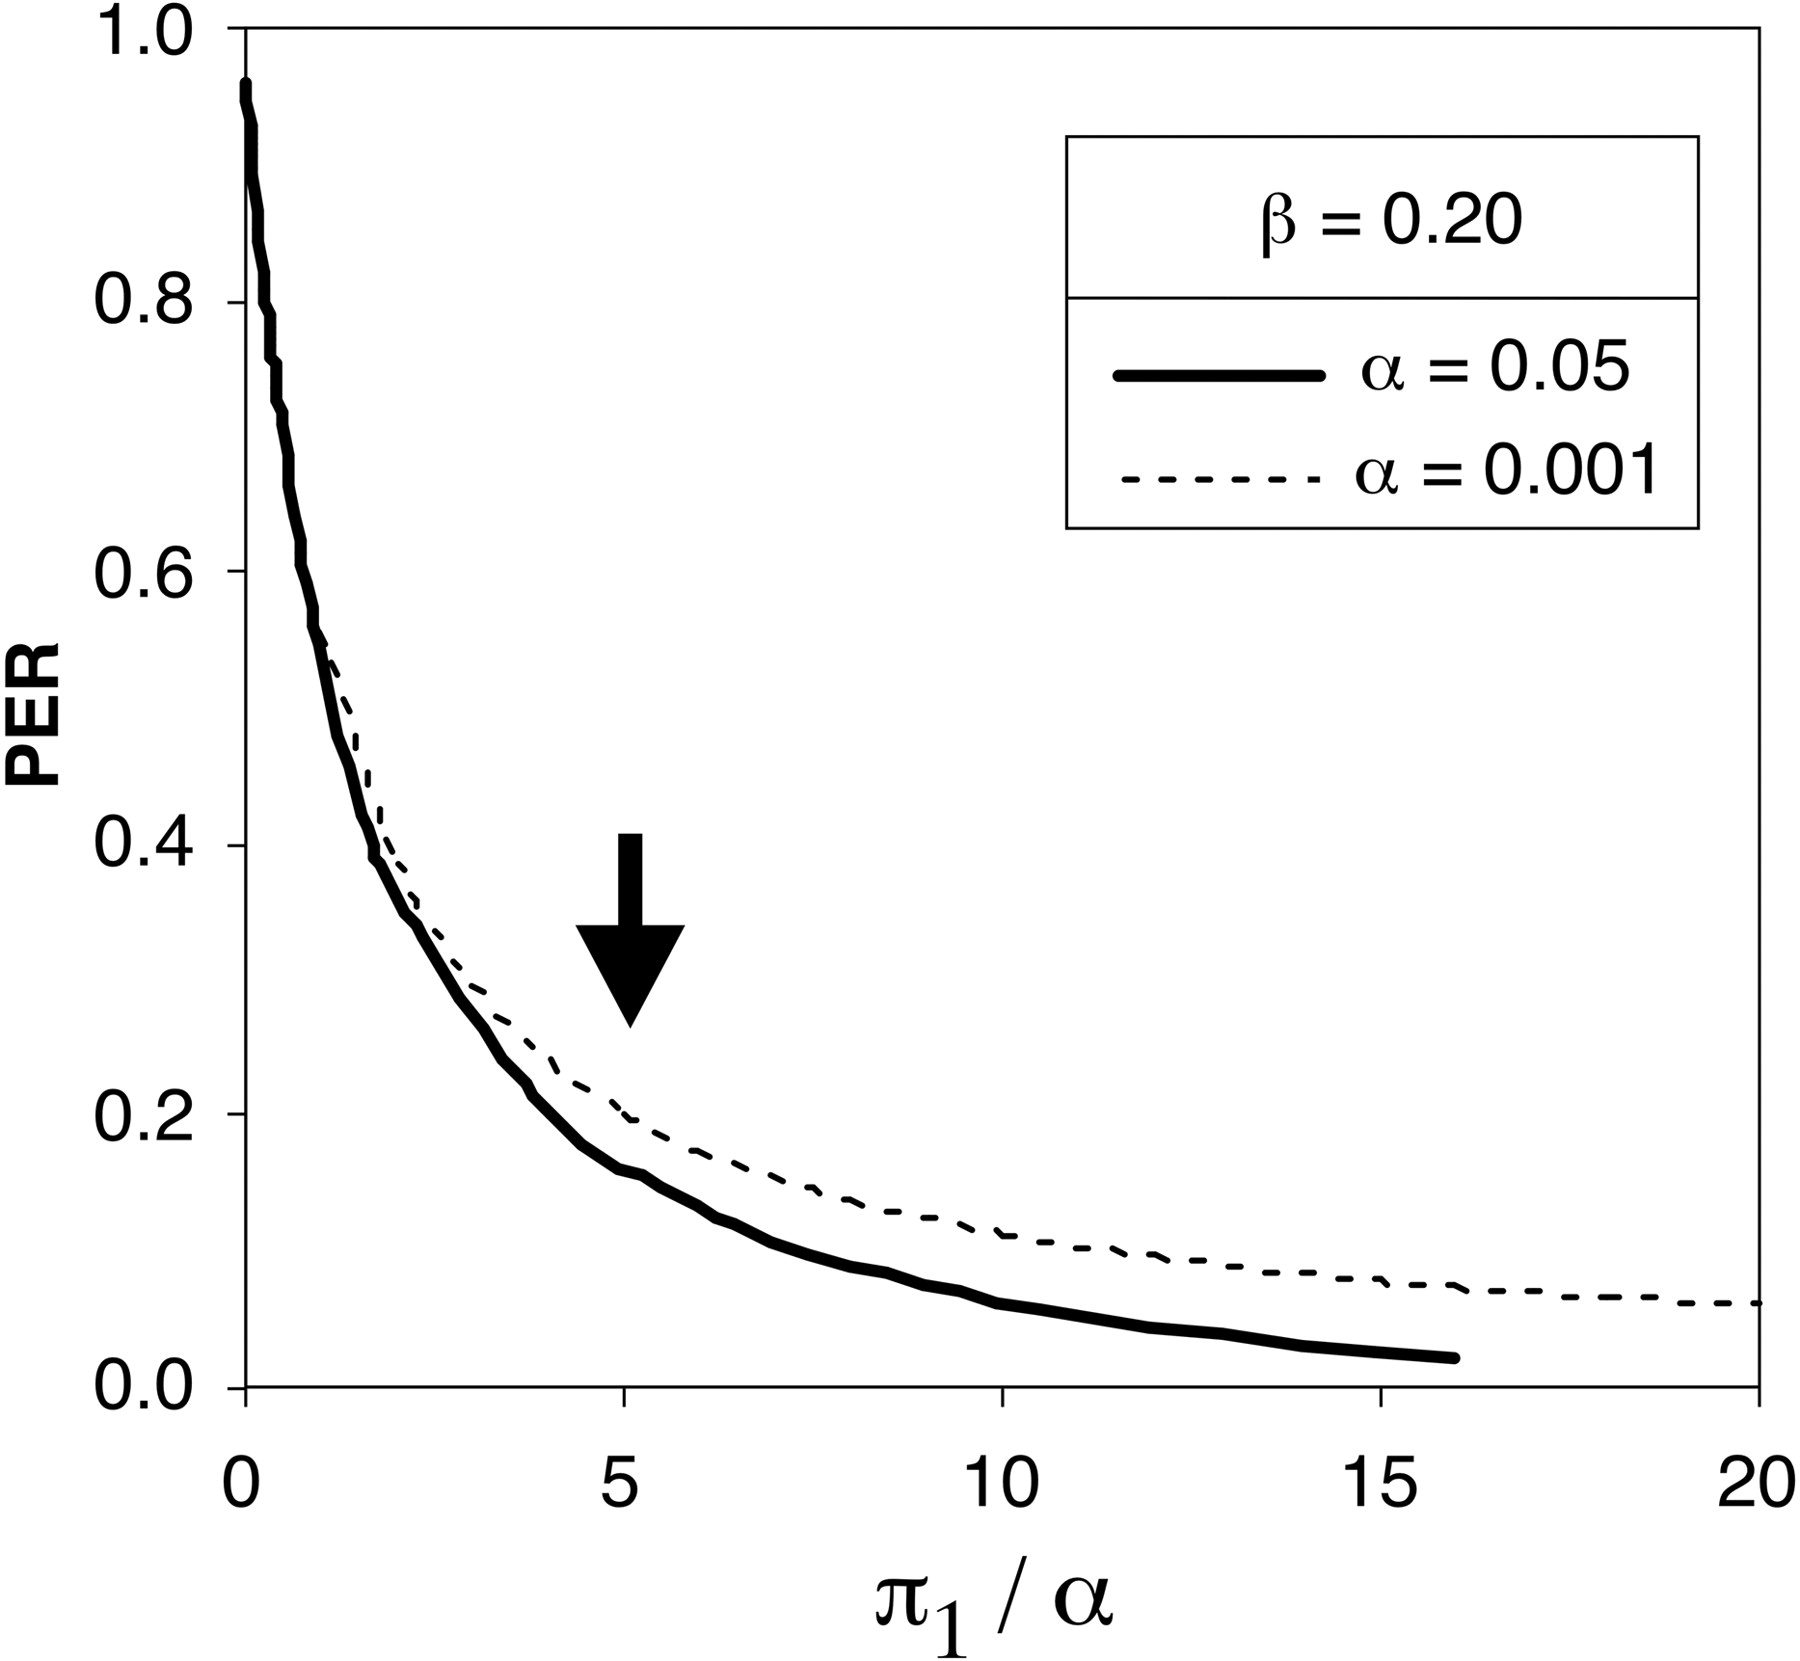
Figure 1
Posterior error rate for an experiment in which the null hypothesis is rejected, as a function of the ratio of π1 to significance level α, for β = 0.2, and two significance levels as shown. As discussed in the text, π1 is the fraction of tests in a family for which the null hypothesis is actually false. The arrow shows the approximate minimum ratio to achieve a PER of no more than 0.2.


