
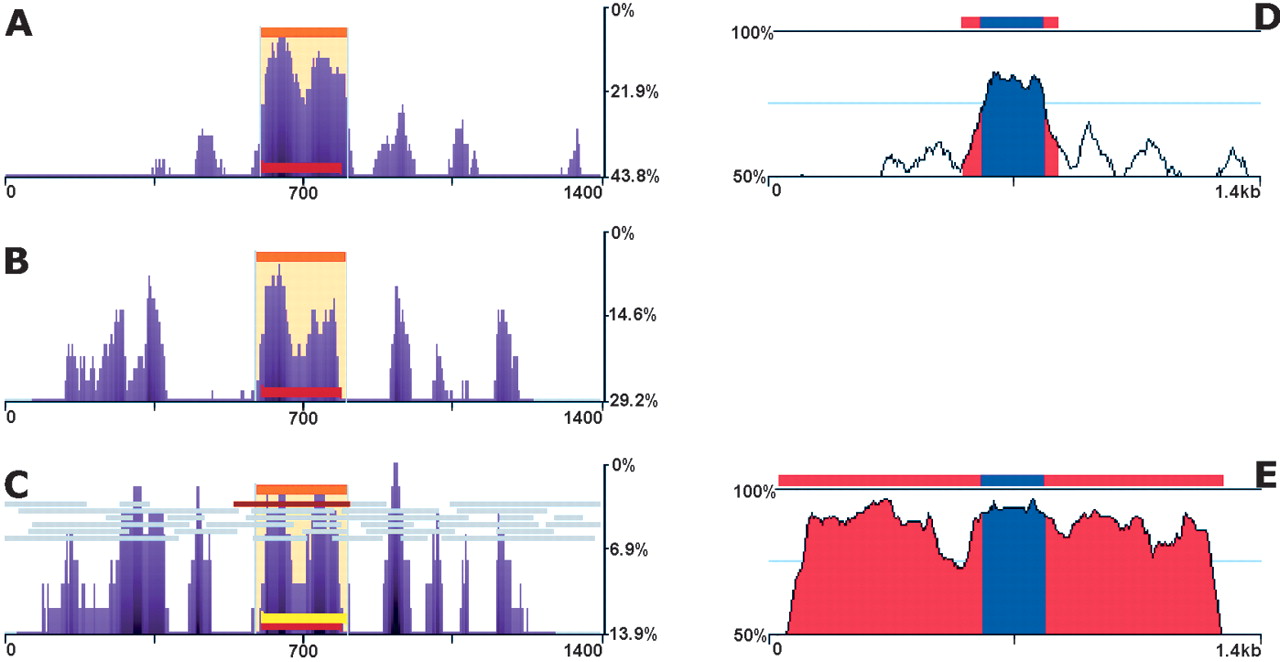
Predicting exons in single primate pairwise alignments. eShadow analysis for ApoB (1.4 kb) region using human/mouse (A), human and 14 primate sequences (B), and human/Allouatta seniculus sequences (C); 50-bp sliding window was utilized to smoothen the conservation profile. (Right) Human/mouse (D) and human/Allouatta seniculus (E) sequence comparisons plotted with standard 50%–100% thresholds and 100-bp sliding window. Exons (blue) and evolutionarily conserved regions (ECRs) (red) are indicated in D and E zplots (http://zpicture.dcode.org). HMMI predictions (beige), ORF predictions (gray), exon annotations (red), and exon predictions (yellow) are visualized in eShadow plots (A–C). Percent variation: y-axis, size in bp: x-axis (A–C). Percent identity: y-axis, size in kb: x-axis (D,E).


