
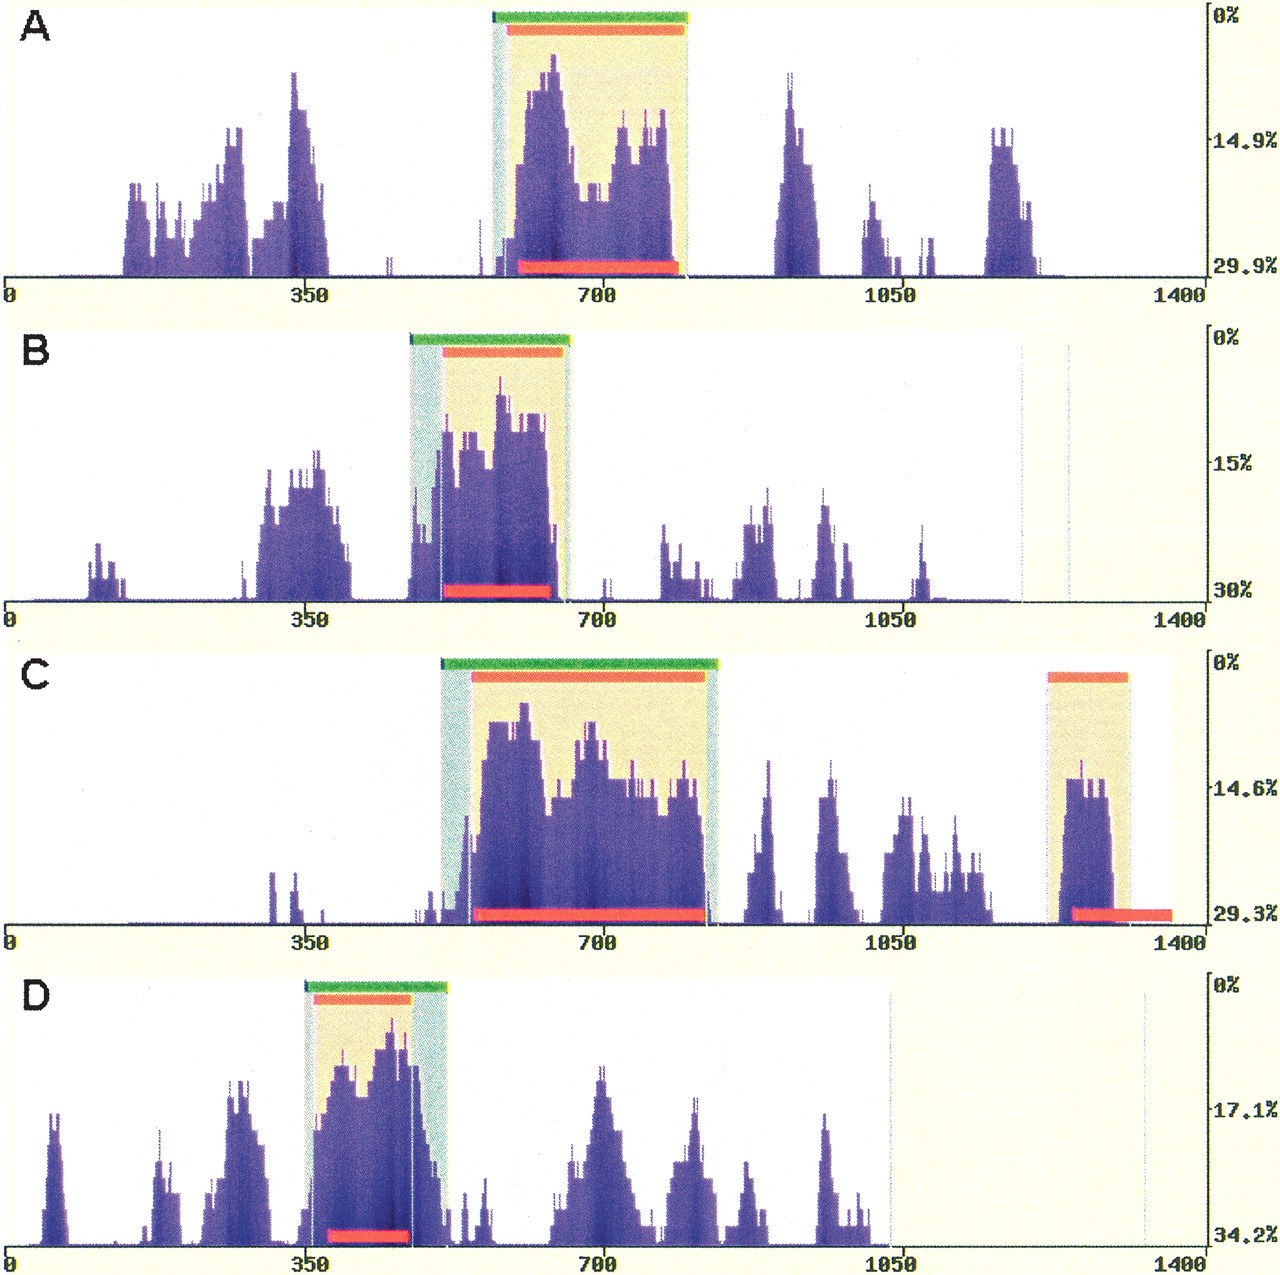
Figure 2
Predicting exons in multiple primate alignments. eShadow exon prediction and conservation plots for ApoB (1.4 kb) (A), Plasminogen (1.2 kb) (B), LXR-α (1.35 kb) (C), and CETP (1 kb) (D) loci using multiple primate alignments. HMMI predictions (0.85/0.77/0.1) are in beige and DT regions (15/100) are in green. The locations of known exons are depicted as red bars. Sequences are available at NCBI (accession nos. AY190030–AY190042, AY192729–AY192785).


