
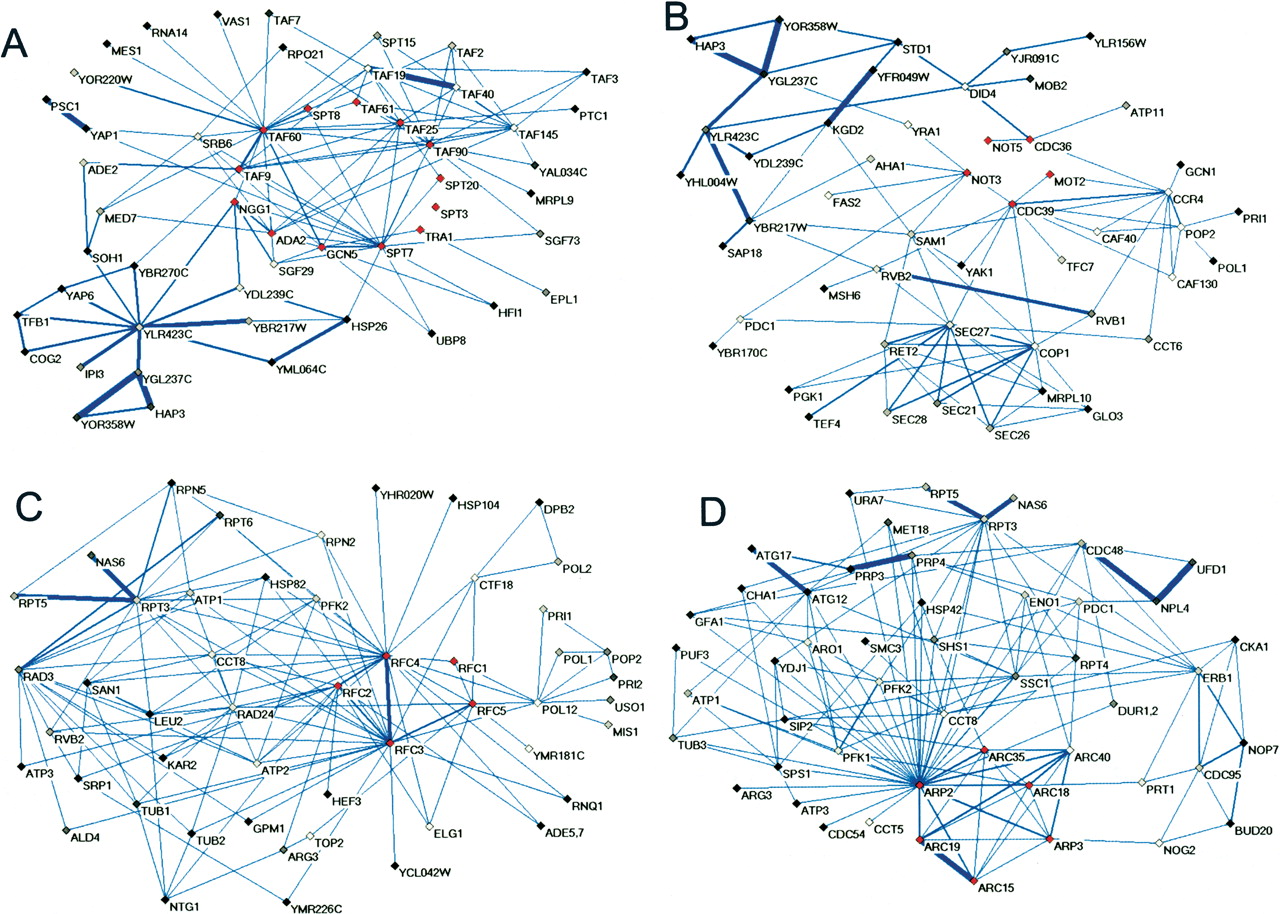
Figure 2
Results of several examples using MIPS complexes (Mewes et al. 2002) as “core complex” queries. Probabilistic interaction subgraphs are visualized by the software Pajek (Batagelj and Mrvar 1998). Query proteins are marked in red, and the top 50 proteins returned are colored in grayscale according to rank, with lighter coloring indicating better rank. Each edge is given thickness proportional to its posterior probability. Shown are SAGA complex (A), NOT complex (B), replication factor C complex (C), and the Arp2/Arp3 complex (D).


