
Figure 9
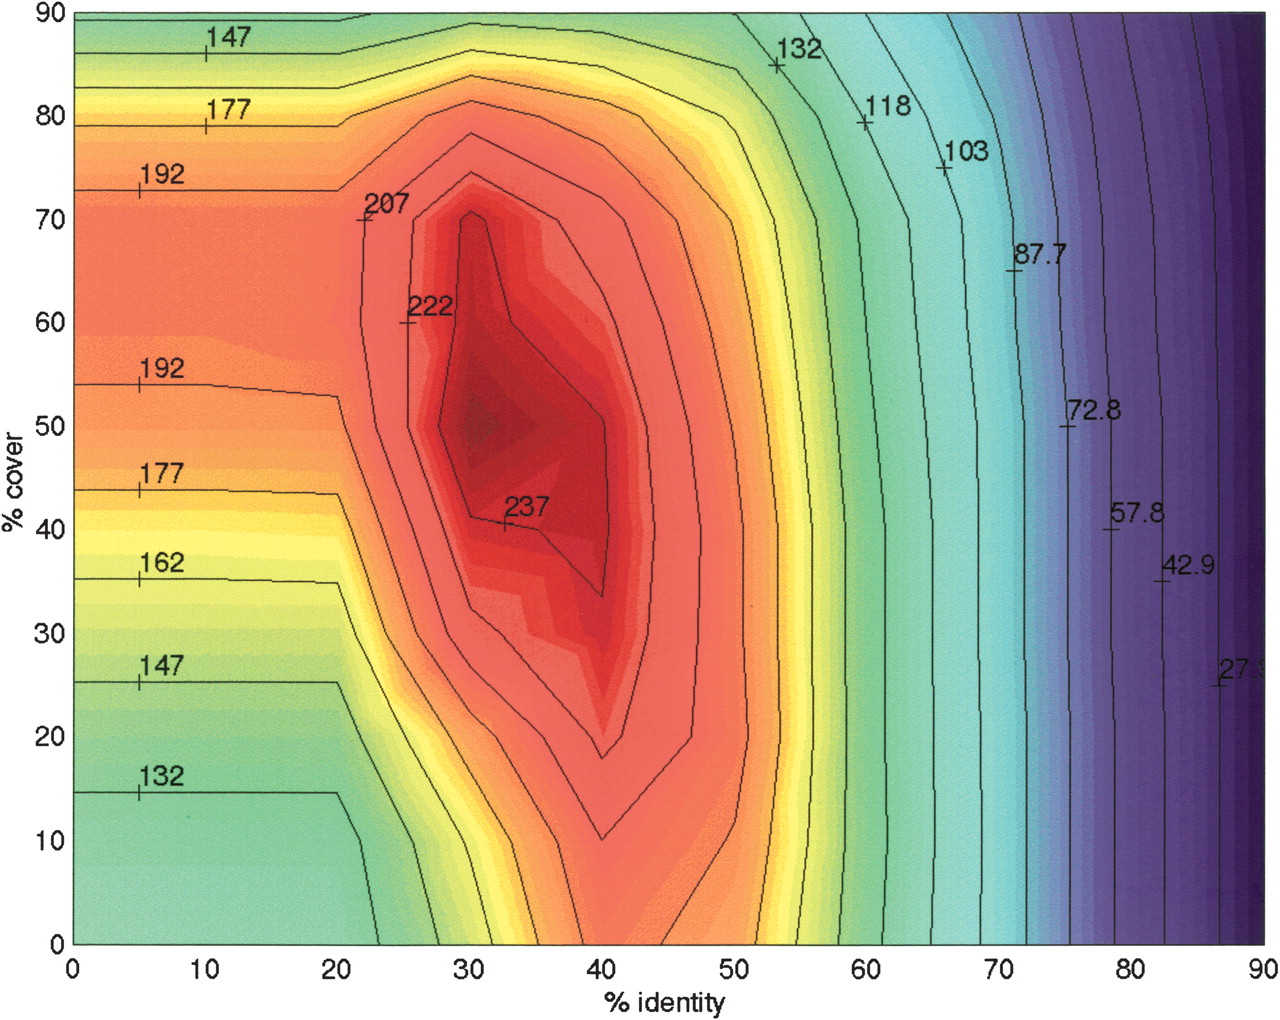
Contour plot showing, for each choice of identity and cover, the number of nontrivial families that are (90, 90) clusterable.
(Downloading may take up to 30 seconds. If the slide opens in your browser, select File -> Save As to save it.)
Click on image to view larger version.
Contour plot showing, for each choice of identity and cover, the number of nontrivial families that are (90, 90) clusterable.
 CiteULike
 Delicious
 Digg
Digg Facebook
 Google+
 Reddit
 Twitter
