
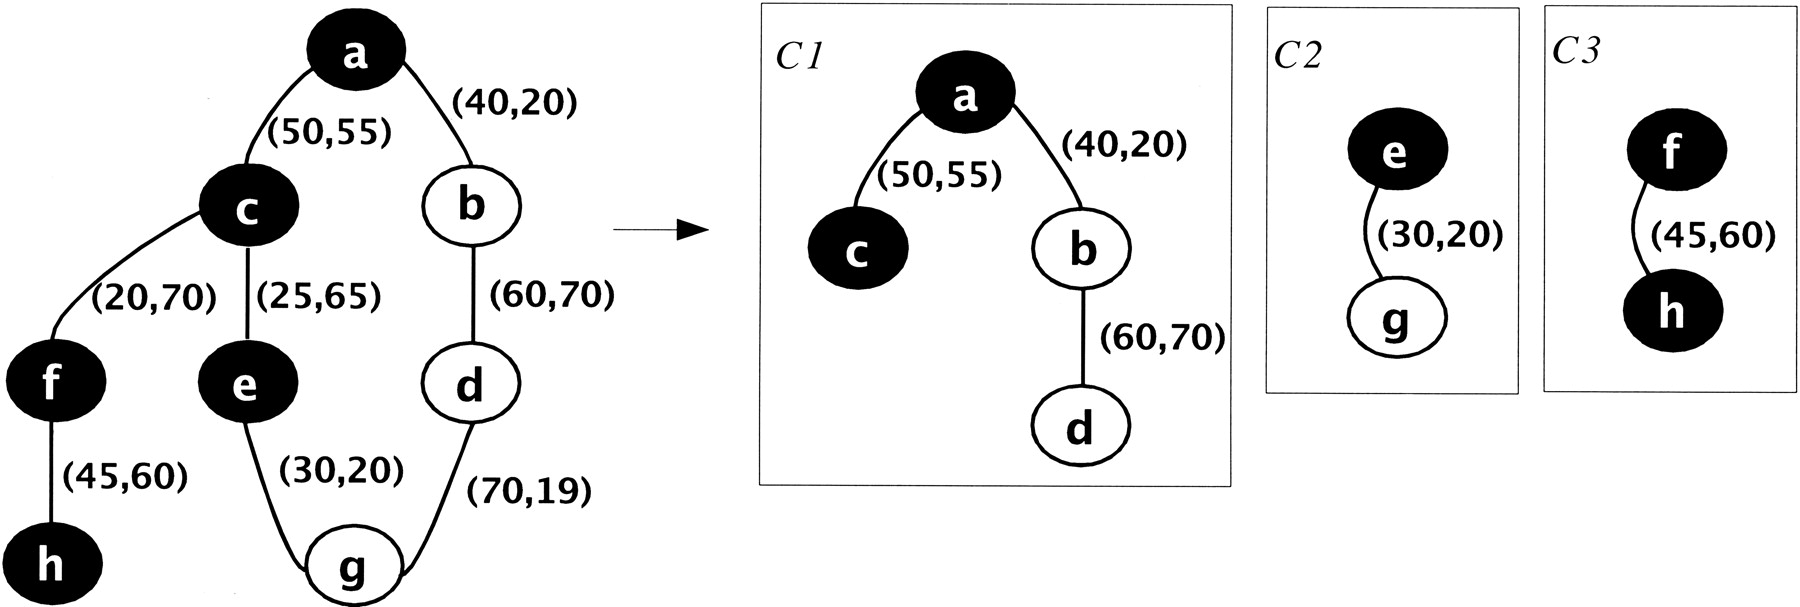
Figure 2
A similarity graph G of eight proteins is shown at left. The weights on the edges show the percentage identity and cover of the best match between the pairs of proteins. When clustering with threshold (30, 20), G30, 20 is created from G by removing edges c—e, c—f, and d—g. G30,20 contains, three connected components that form the clusters C1, C2 C3 shown at right.


