
Figure 12
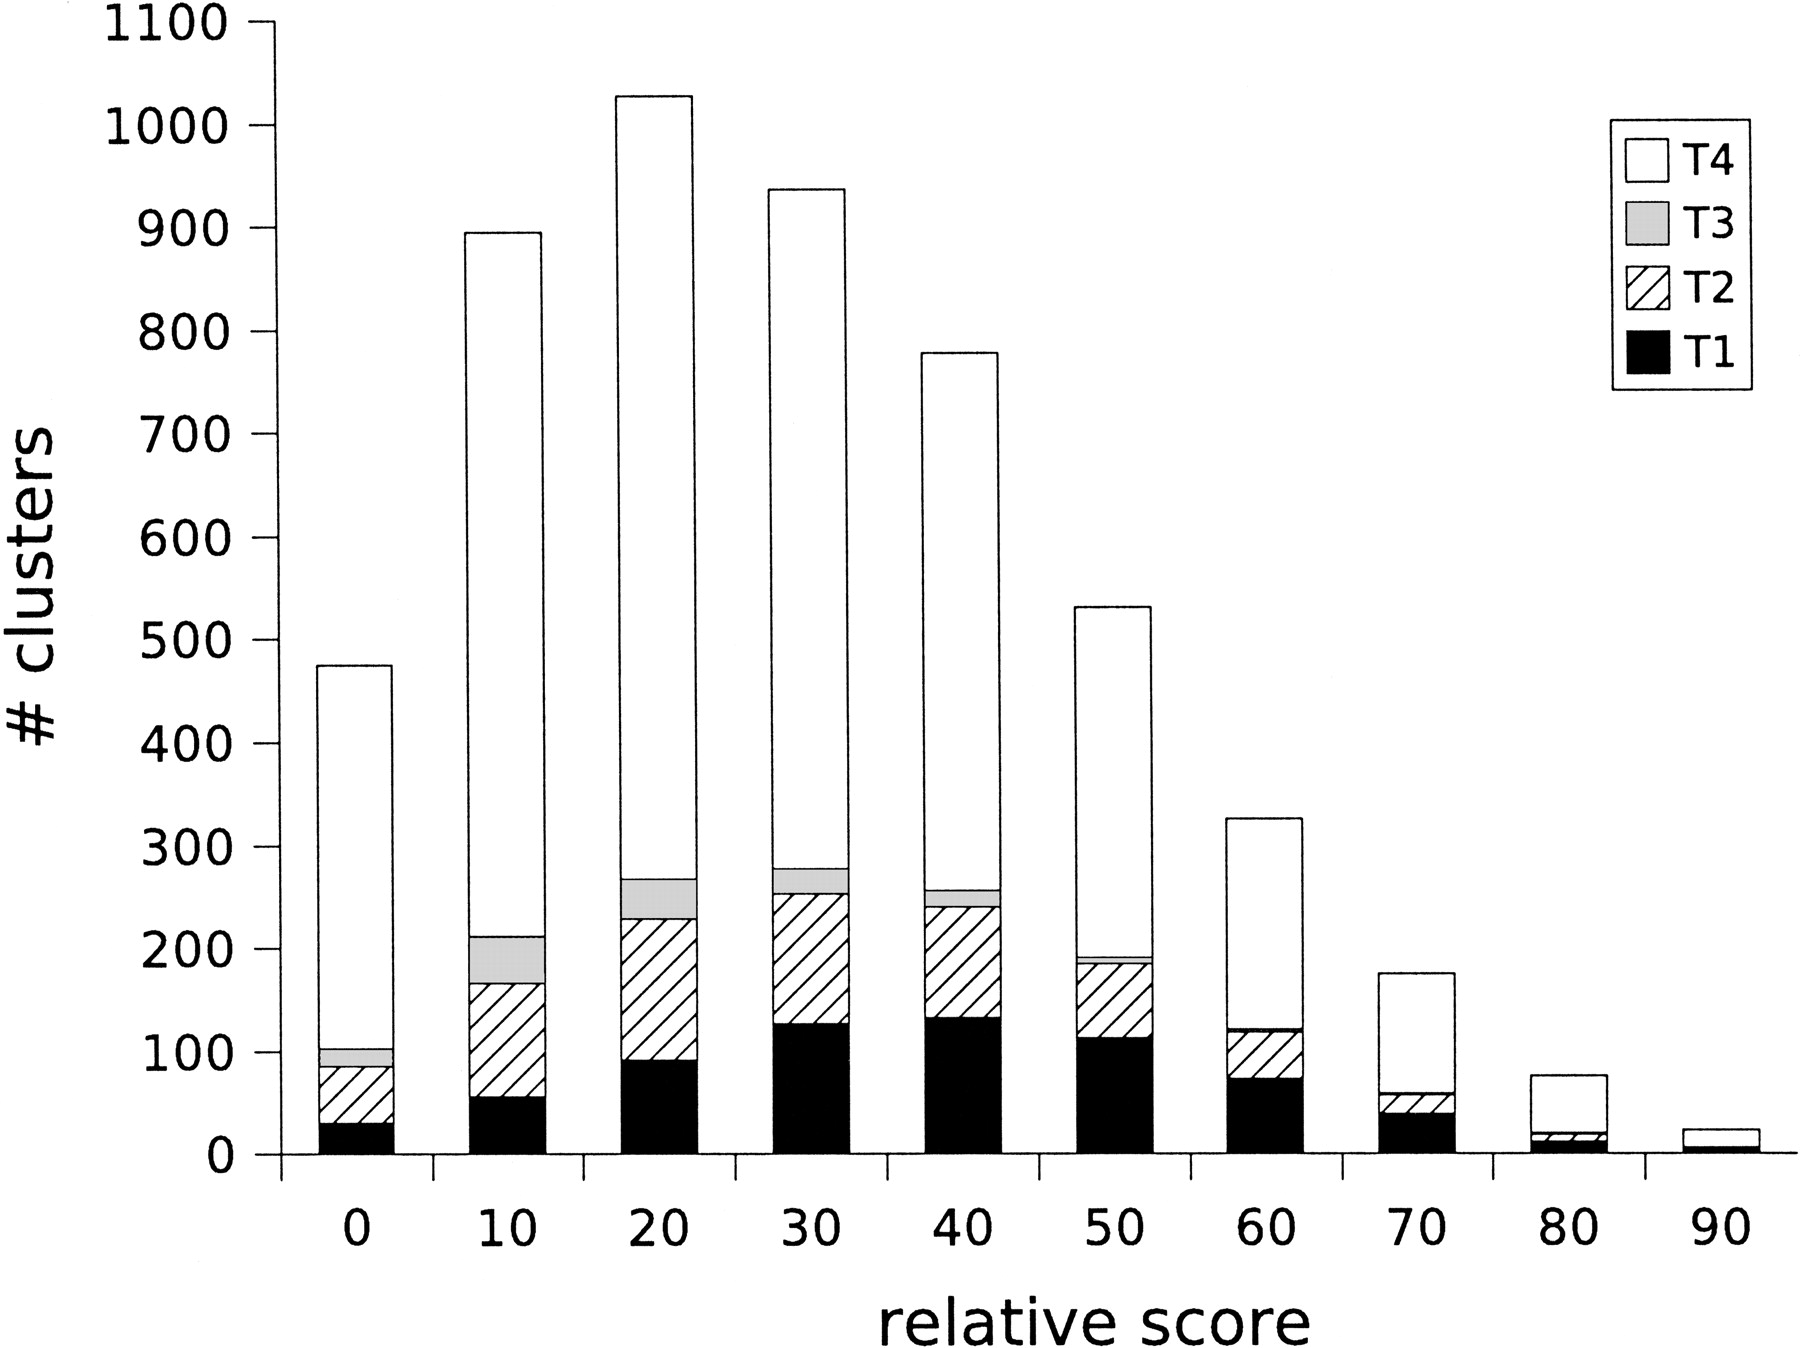
Distribution of the number of clusters of size at least five at different relative score thresholds. The clusters are further classified on the basis of their purity, etc.
(Downloading may take up to 30 seconds. If the slide opens in your browser, select File -> Save As to save it.)
Click on image to view larger version.
Distribution of the number of clusters of size at least five at different relative score thresholds. The clusters are further classified on the basis of their purity, etc.
 CiteULike
 Delicious
 Digg
Digg Facebook
 Google+
 Reddit
 Twitter
