
Figure 10
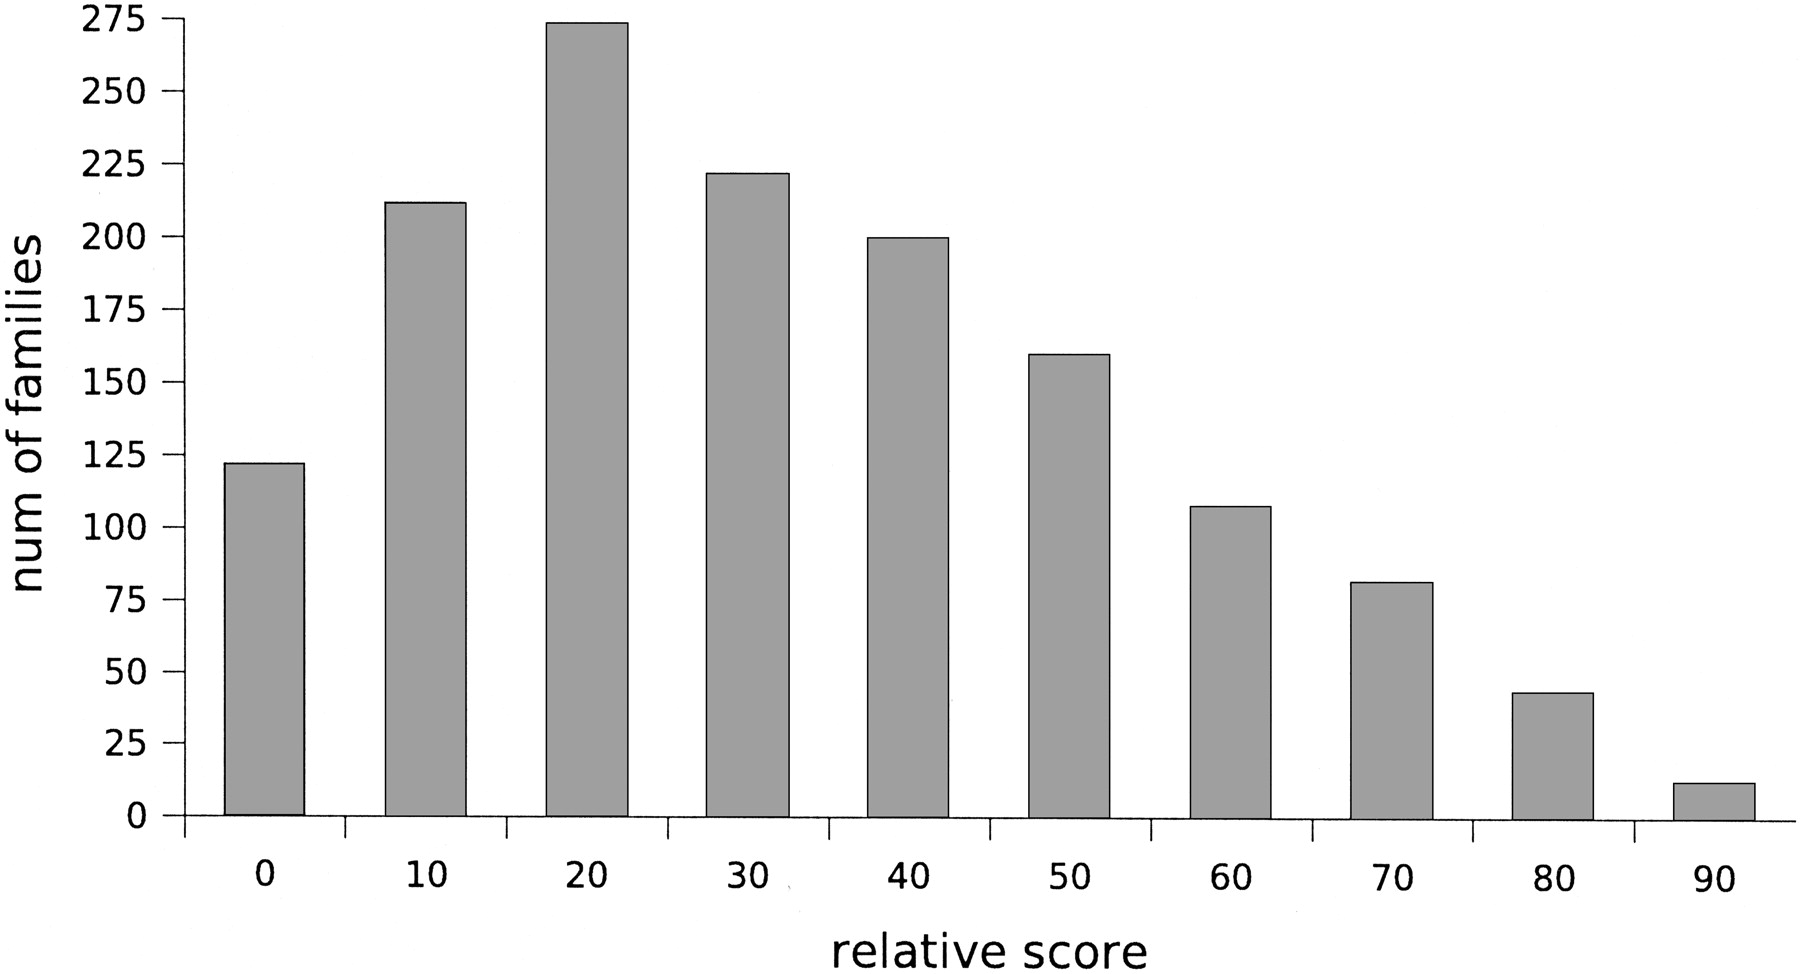
Number of families that are (90, 90) clusterable at different levels of relative score thresholds.
(Downloading may take up to 30 seconds. If the slide opens in your browser, select File -> Save As to save it.)
Click on image to view larger version.
Number of families that are (90, 90) clusterable at different levels of relative score thresholds.
 CiteULike
 Delicious
 Digg
Digg Facebook
 Google+
 Reddit
 Twitter
