
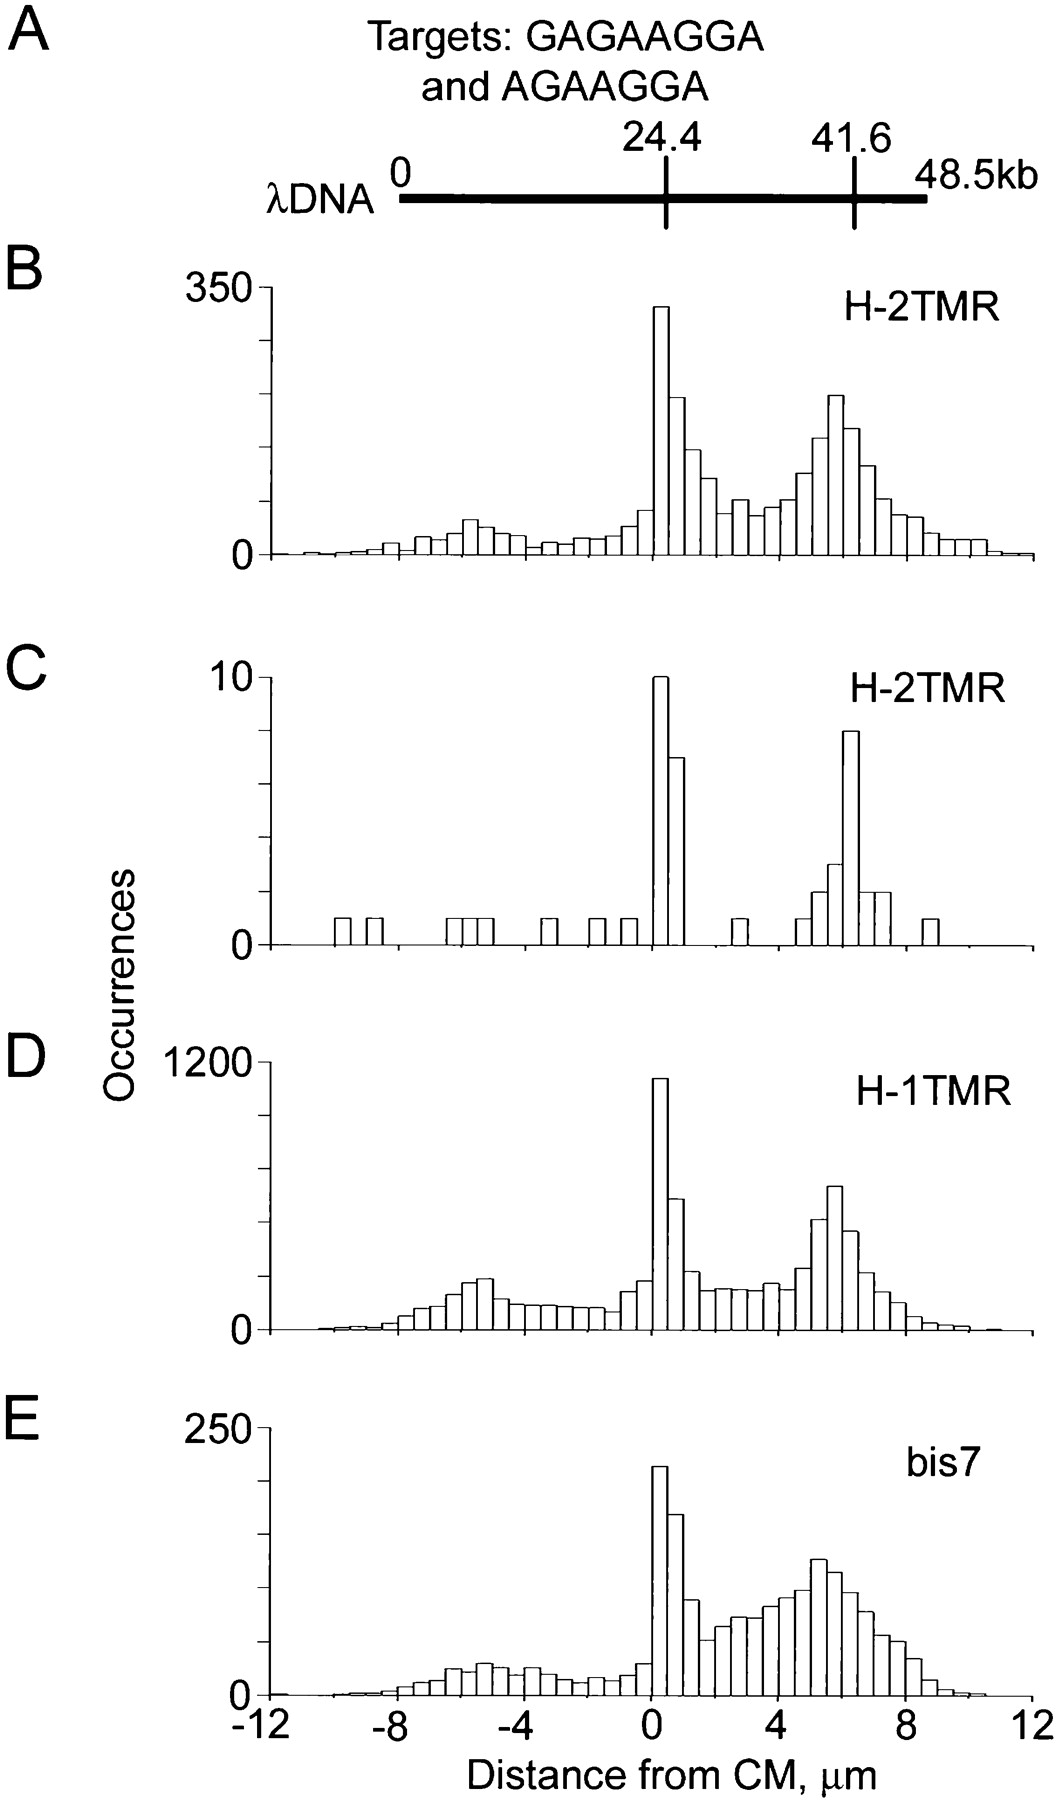
Theoretical and measured maps of λ phage DNA obtained with H-2TMR, H-1TMR, and bis7 bisPNA tags (Table 1). Motif H has sequence (amino terminus)TCCTTCTC(carboxyl terminus) and motif bis7 has sequence (N)TCCTTCT(C); their corresponding targets are (5′)GAGAAGGA(3′) and (5′)AGAAGGA(3′). (A) Theoretical motif map obtained using either H or bis7. (B–E) Experimental maps obtained with H-2TMR, H-1TMR, and bis7 tags. The data sets used to obtain the maps B, D, and E included 2562, 7794, and 1909 total individual molecular traces, respectively. Map C was obtained using a subset of only 57 molecular traces from the same data set used on map B. These 57 molecules belonged to a very narrow range of burst and linear sizes, representing a small spot within the red box on the graph Figure 2D. All experimental maps are aligned using their centers of molecules (CM, at 0 microns). The center of the theoretical map is aligned with the experimental CM. Theoretical map was scaled using 0.336 μm/kb ratio (see text for details).


