
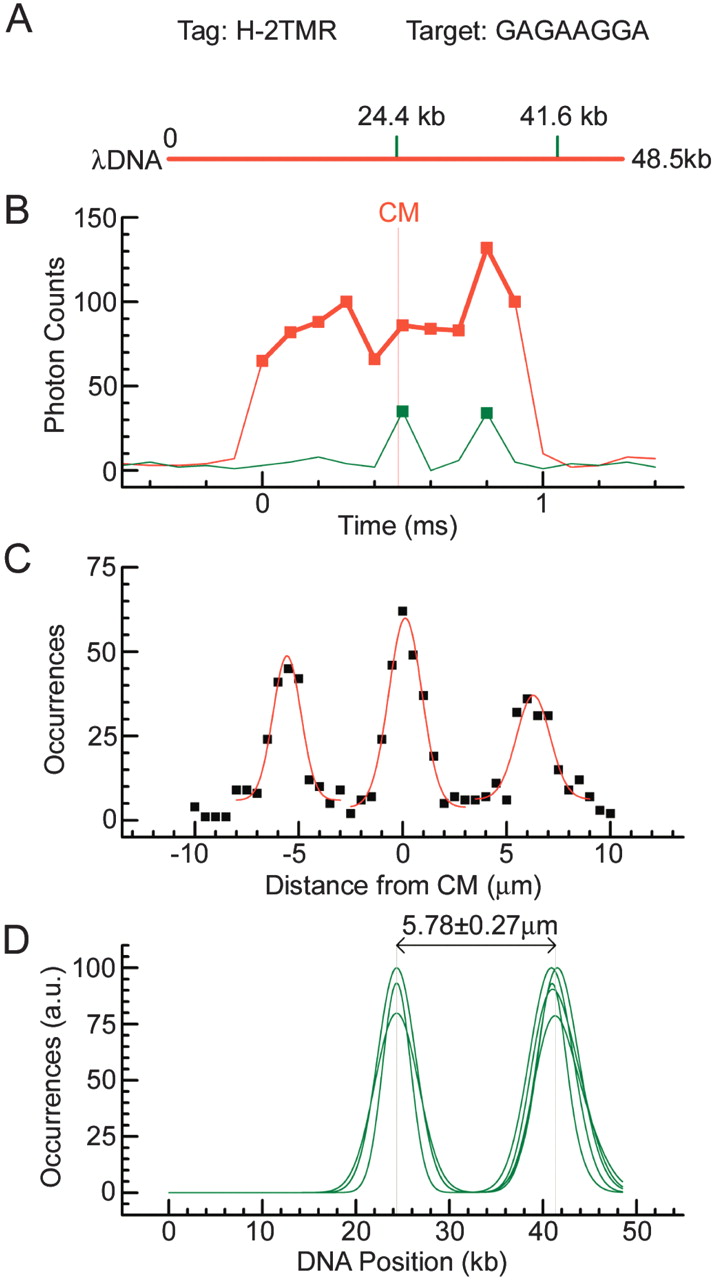
Mapping of bisPNA tag H-2TMR on λ phage DNA. (A) Theoretical λ DNA (48.5 kb) map. Motif H has sequence (amino terminus)TCCTTCTC(carboxyl terminus) (Table 1), corresponding to the target (5′)GAGAAGGA(3′). Positions of motif target sites are shown with green dashes. These motifs are separated by 17.2 kb. (B) Actual fluorescence data traces from a single motif tagged λ DNA molecule. Motif tag fluorescence (green trace) and intercalated DNA fluorescence (red trace) are detected in data channels 1 and 2, respectively (see also Fig. 1C). The vertical gray line shows the position of the center of the molecule (CM). (C) A map obtained by summing of ∼500 single molecule traces. Gaussian fits to the tag position data are represented by the red line. (D) Oriented maps measured in five different experiments with different sample preparations to illustrate reproducibility. Only Gaussian fits are presented. The maps are aligned in the middle of the interpolated central peak. The maps are normalized to the higher of the two peaks. The average measured geometrical distance between the motif targets is presented.


