
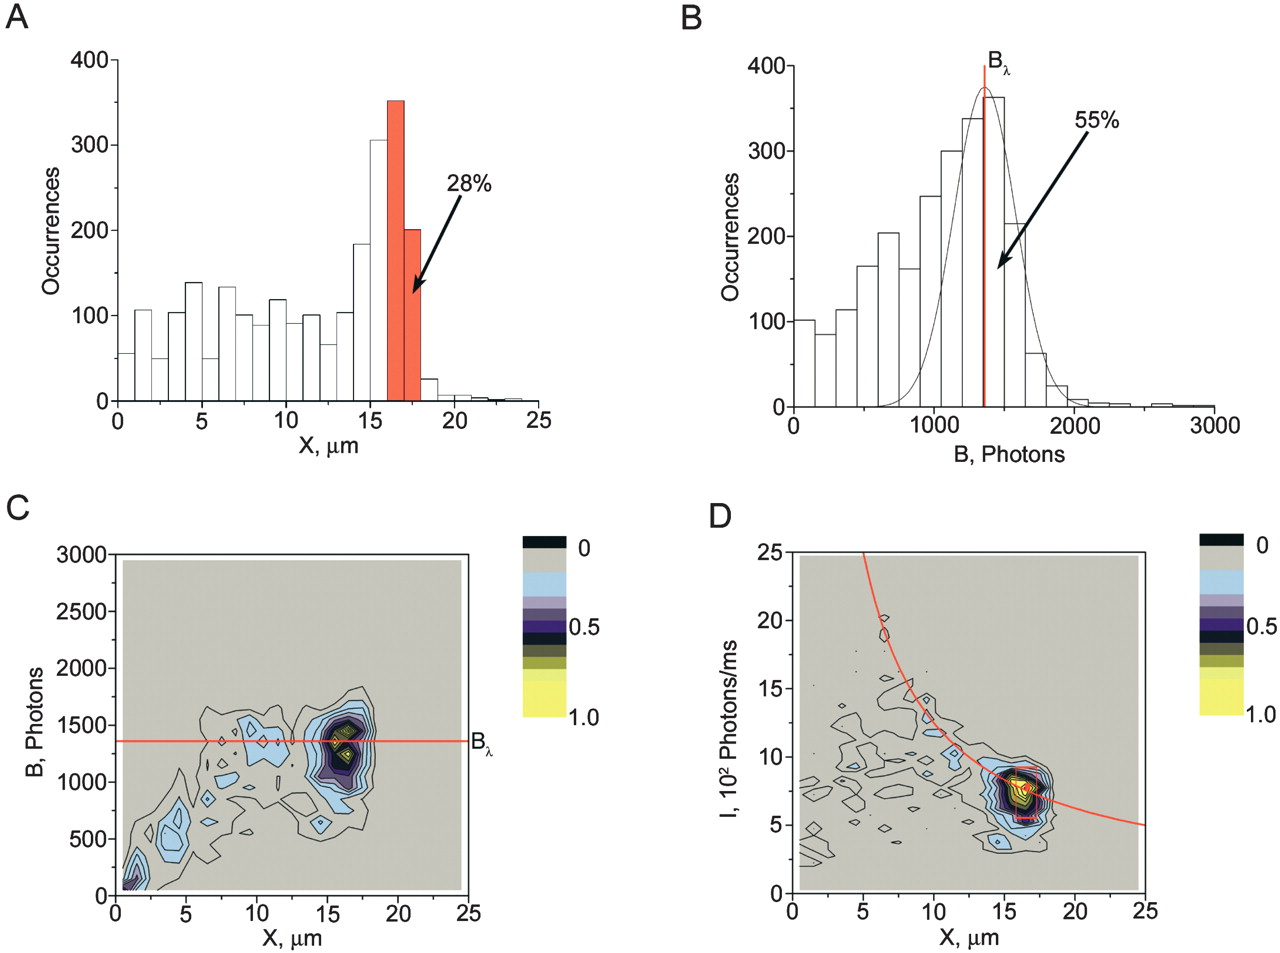
Properties of detected molecules of λ phage DNA (48.5 kb) in a representative experiment. (A) The distribution of DNA lengths (sizes of DNA projections X onto the movement direction) for detected DNA molecules. (B) The distribution of burst sizes B (total number of photons per detected molecule) of the stained DNA backbone (data channel 2). The peak corresponding to full-size λ DNA is interpolated with a best fit Gaussian curve. Scatter plots of burst size B vs. DNA length X (C) and of average intensity of DNA backbone I vs. X (D). C and D include points representing single observed DNA molecules stained with the TOTO-3 intercalating dye. Because the points are concentrated in small regions, we have chosen to present their color-coded density rather than the points themselves. The solid red lines in C and D correspond to the center of the Gaussian distribution Bλ interpolating the full-size DNA molecules shown in B. A total of 2373 individual molecular traces are represented in this data file. The data points included in the red box in D were used to calculate one of the DNA maps presented in Figure 3D. This selection contains ∼400 molecules. The corresponding interval, including molecular traces with projections between 16.25 and 17.25 μm, is outlined in red in A.


