
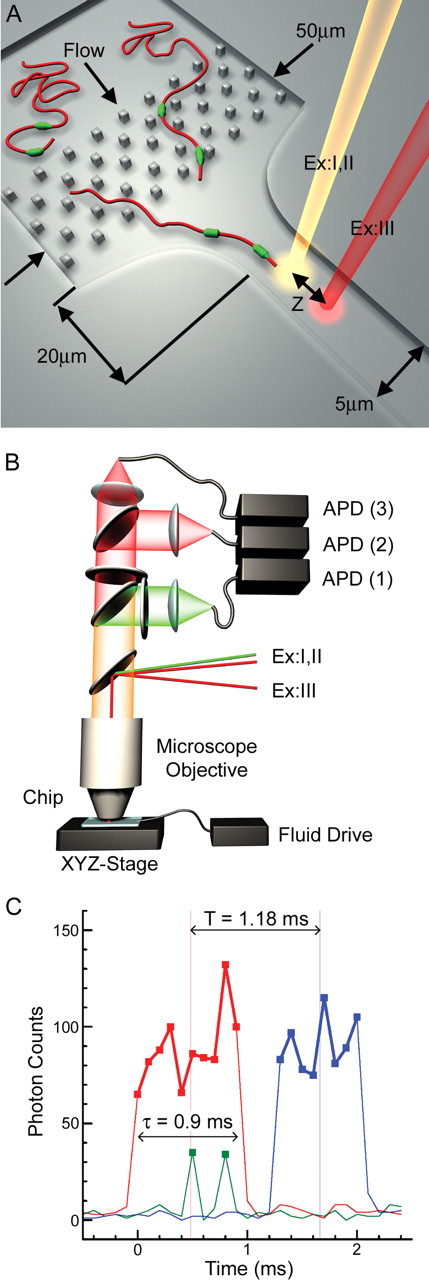
Schematics of the Direct Linear Analysis (DLA) technology. (A) A cross-section of the microfluidic DNA stretching microchip (top). A typical design, one of a few, is presented. See text for the exact parameters of the chip used in this study. (B) Optical scheme (side view). The excitation and detection are arranged within a confocal fluorescence microscope. The excitation laser beams are directed into the microscope objective with a dichroic mirror that reflects the light with 532 nm (beam ExI) and 633 nm (beams ExII and ExIII) wavelengths, but is transparent to the fluorescence emission excited by these beams. The emission is further split by another dichroic mirror and bandpass filters. Fluorescence excited by the green laser is delivered by optical fiber to the photon-counting avalanche photodiode (APD) for signal detection in data channel 1. Fluorescence excited by red beams ExII and ExIII is directed to the APDs of data channels 2 and 3, respectively. (C) Typical raw data traces from data channels 1–3 for a single tagged DNA molecule. The red and blue traces arise from fluorescence of the intercalating dye when the DNA backbone travels through the excitation spots ExII and ExIII, respectively. The green spikes are detected when the DNA-bound PNA tags pass through the excitation spot ExI and emit bursts of photons.


