
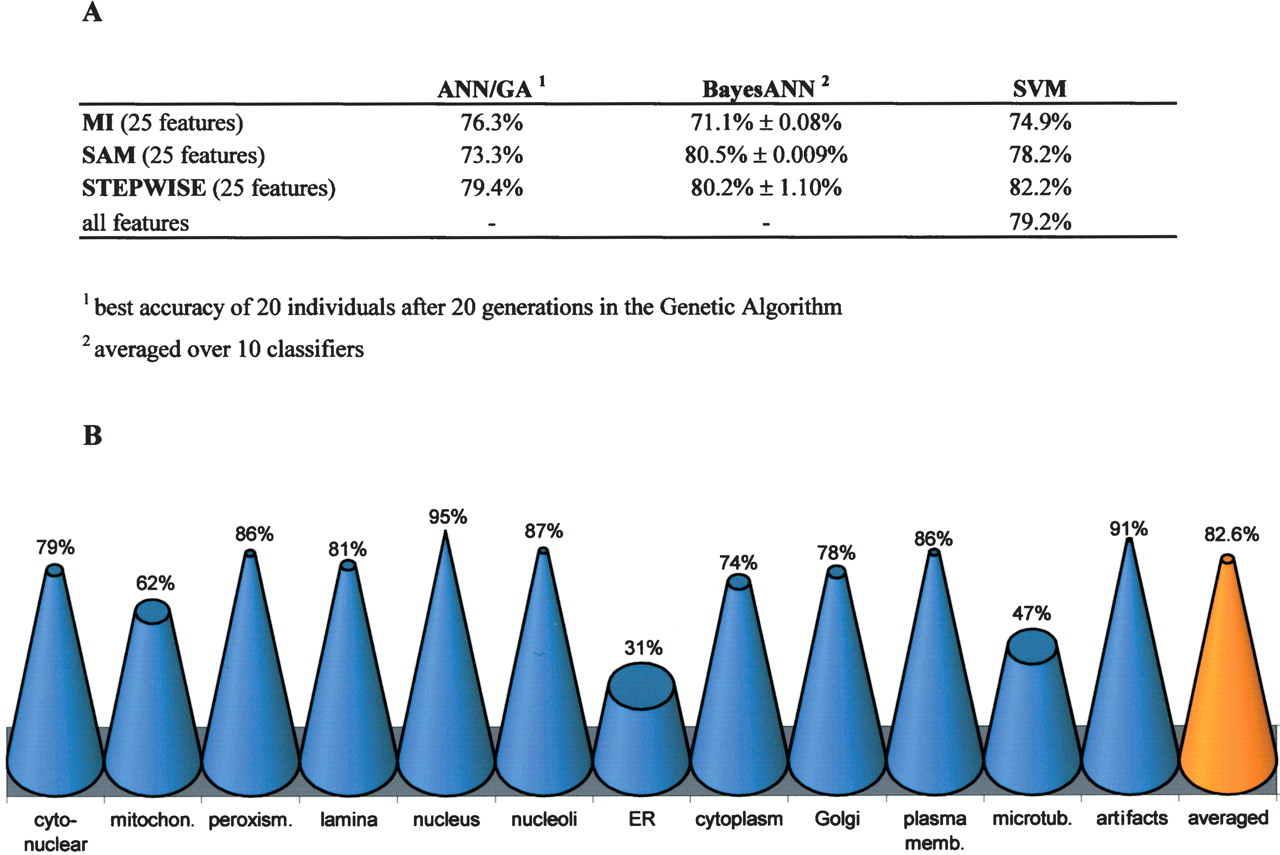
Accuracy of phenotype classification. (A) Classification accuracy determined on the test set for three different classification algorithms using the first 25 ranked features obtained by three different feature selection methods. In contrast to the BayesANN approach, the ANN/GA runs with nonconvergent fivefold cross-validation as regularization. As the result of the BayesANN classifier is dependent on random initialization of network weights, the averaged classification accuracies and the corresponding standard deviations of 10 classification runs of the same test set are shown, while the ANN/GA generates many similar networks during the evolutionary search process. Only the SVM was trained with the entire set of 323 features. (B) While BayesANN performed best on average in combination with SAM for feature selection, the overall best classifier was obtained by combination of BayesANN with STEPWISE (82.6% accuracy). The cone diagram shows single class accuracies obtained by this overall best classifier for all subcellular classes and artifact class.


