
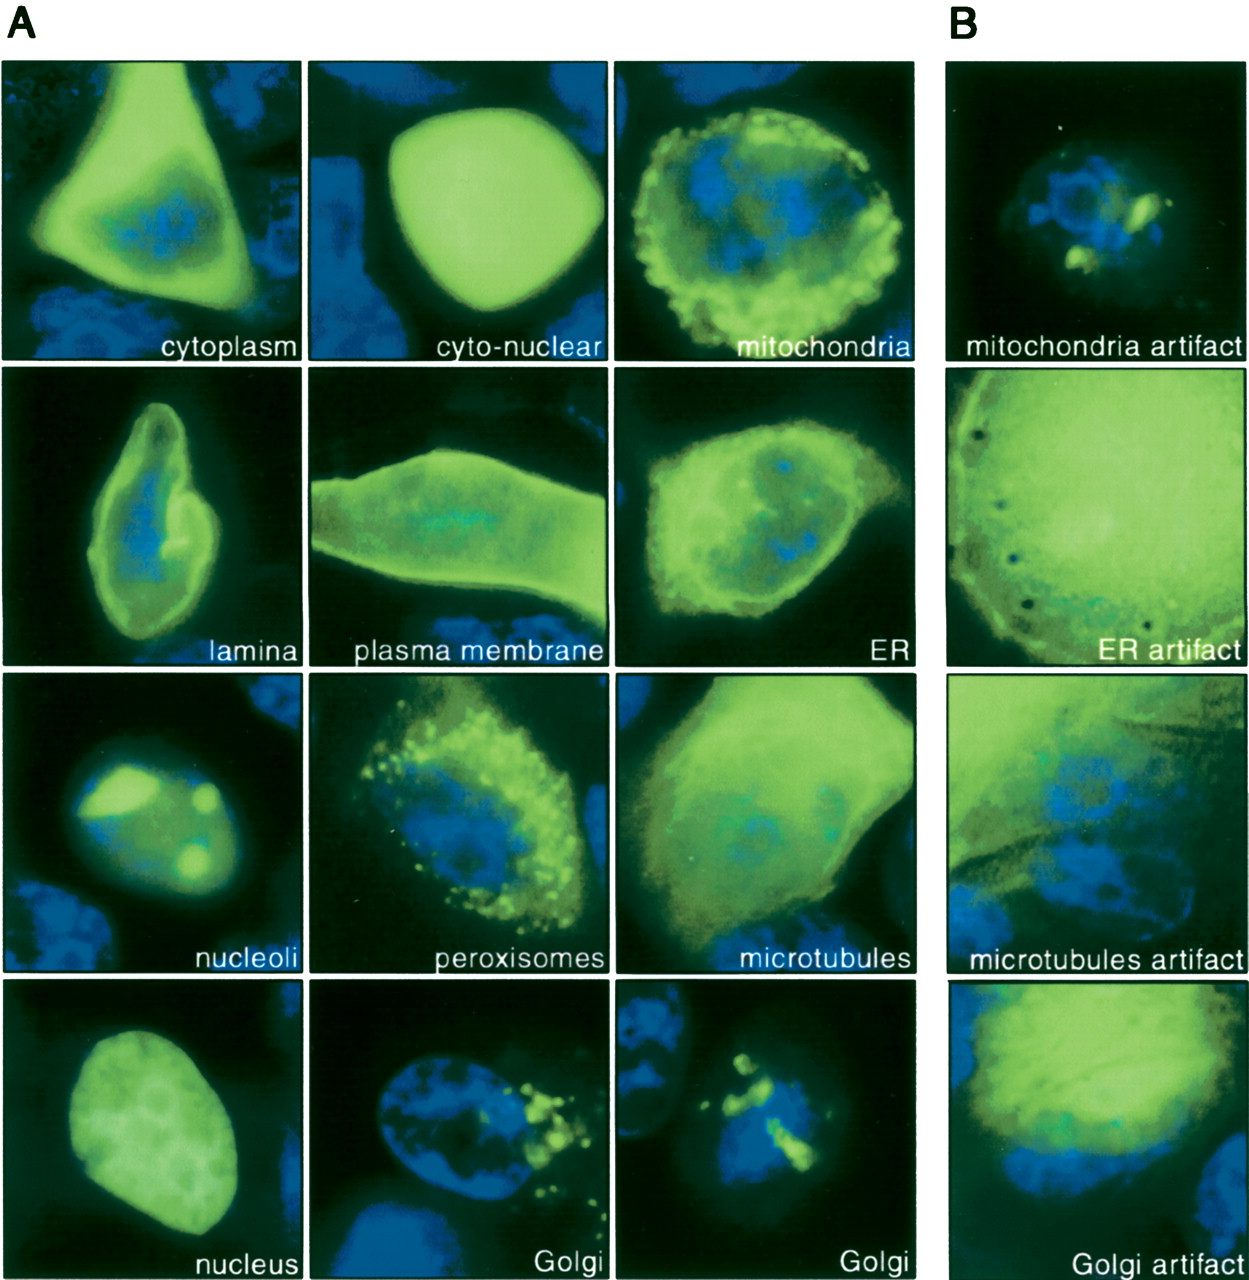
Automatically captured images of live MCF7 cells representing localization classes. (A) Cells were counterstained by Hoechst (blue) and different GFP-tagged cDNAs were expressed in cells transfected on cell arrays (green). Image acquisition is designed in such a way that each image contains only one cell. From top left to bottom right: GFP-tagged NES→cytoplasm (96 images), EGFP→cyto-nuclear (170 images), GFP-tagged cDNA #488→mitochondria (108 images), YFP-tagged LB1→nuclear lamina (108 images), GFP-tagged ErbB1→plasma membrane (70 images), YFP-tagged SRb→endoplasmatic reticulum (84 images), GFP-tagged cDNA #351→nucleoli (116 images), YFP-tagged cDNA #447→peroxisomes (119 images), YFP-tagged cDNA #22f21→microtubules (78 images), YFP-tagged H2B→nuclear (111 images), YFP-tagged GalT→Golgi (93 images) imaged from two different spatial directions. For cDNA reference see Supplemental Table 1 (see also http://www.dkfz.de/LIFEdb/ and http://harvester.embl.de/; Wiemann et al. 2001). (B) Artifacts of the corresponding subcellular localization class are shown in the right column: mitochondria artifacts (116 images), endoplasmatic reticulum artifacts (99 images), microtubules artifact (67 images), Golgi artifact (77 images). In total 1035 images were labeled as artifacts and assigned to this class. Note that artifact cells show expression levels both below and above the level of expression typically observed for valid cells (left). Hence, the level of expression is not sufficient to discriminate artifact cells from valid cells (see also Supplemental Fig. 1).


