
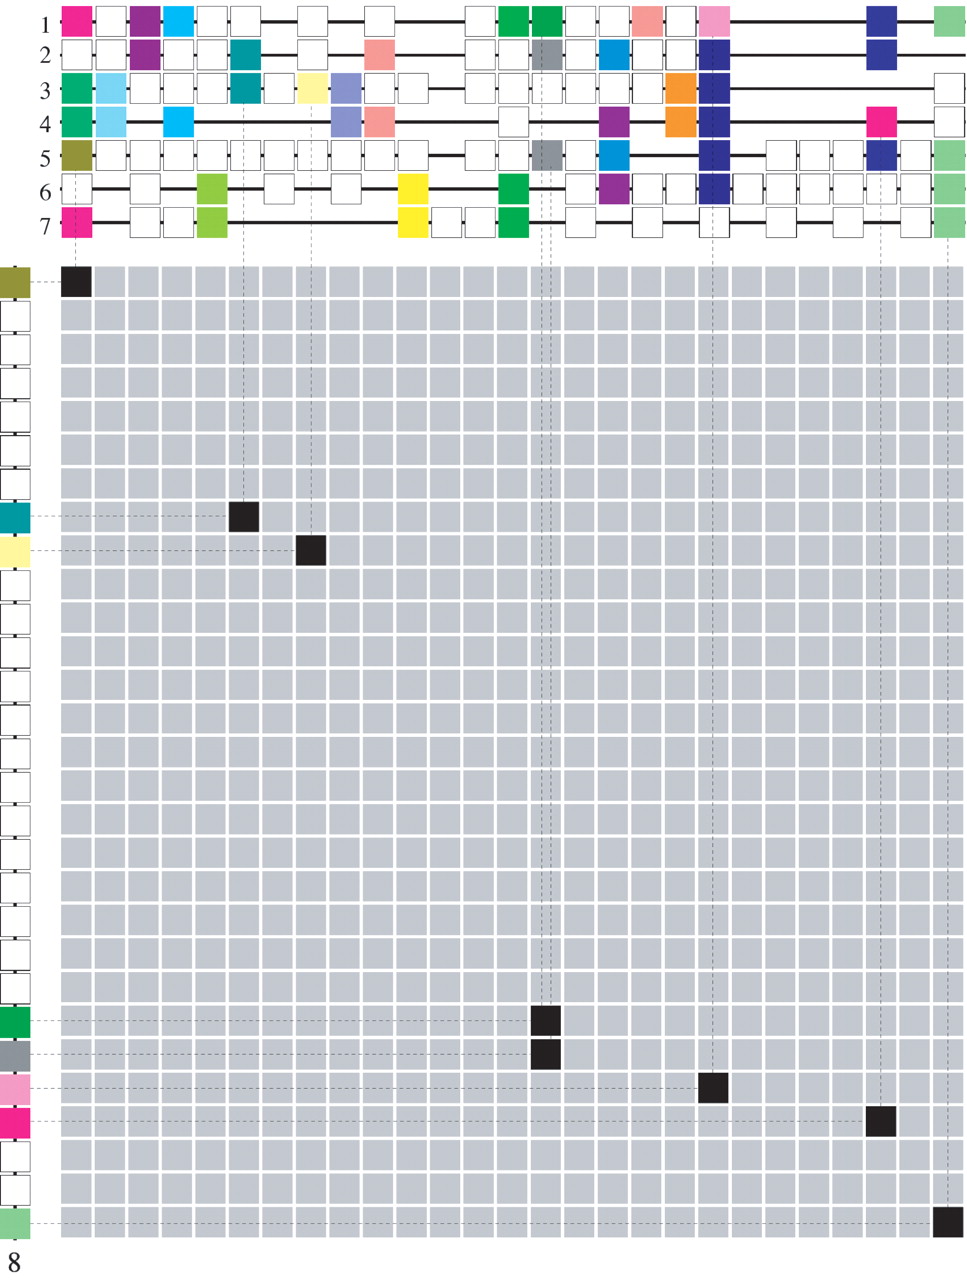
Gene homology matrix (GHM) for the multiplicon shown in Figure 7. The segment numbers correspond to the same segments as in Figure 7. The boxes on the segments represent genes. Genes of the same color are homologs. Tandemly duplicated genes have been remapped (data not shown). Segments 1–7 (above the matrix) are aligned to form a profile. Empty positions on the segments denote gaps in the aligment (see Methods section for details). Using this profile, the homology relationship between segment 8 (left of the matrix) and the other segments in the profile/multiplicon can be established because segment 8 is clearly homologous to the profile (see Discussion for more details).


