
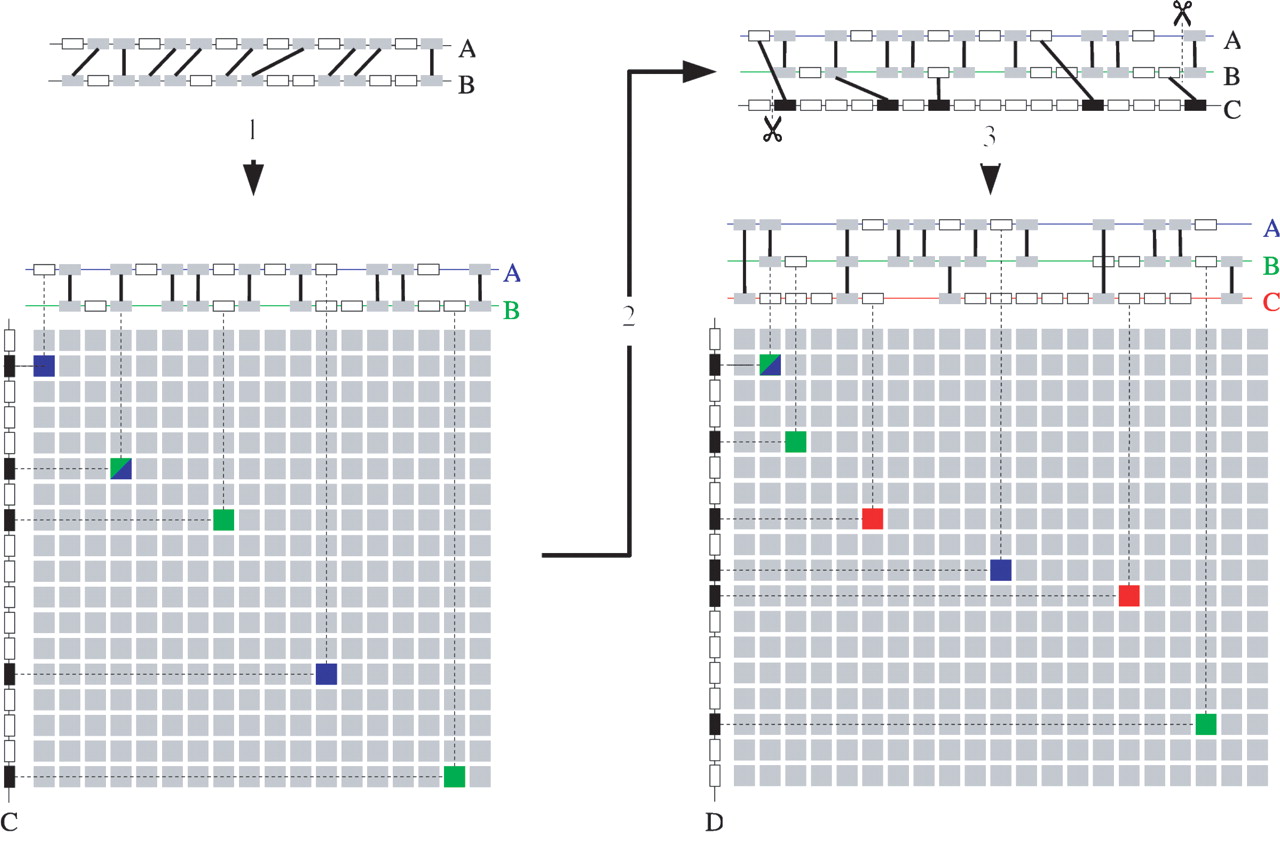
Detection of homology with a genomic profile. (1) An initially detected level 2 multiplicon (a pair of homologous chromosomal segments) is aligned to form a profile as described. The gray boxes connected by lines represent pairs of homologous genes (anchor points) between the two segments. Note that, as a consequence of the alignment procedure, sets of nonhomologous genes (empty boxes) too can be placed on the same position in the profile. A homology matrix can now be constructed by comparing this profile with the genes of a chromosomal segment (segment C on the left of the matrix). Anchor points in the matrix are detected whenever a gene of this chromosomal segment is homologous to one of the genes in any of the segments in the profile. The blue squares represent anchor points between segments A and C, the green between B and C. A blue-green square denotes an anchor point between the three segments. Note that segments A and B each individually only have three anchor points with segment C but when combined in a profile, A and B together have five anchor points with C (counting the common anchor point only once). (2) The multiplicon is extended with the newly detected segment C. The extremities of the multiplicon or segment that are beyond the outermost anchor points are stripped (indicated by dashed lines). (3) Next, the new segment is aligned against the existing profile and consequently added to it. This new profile can again be compared against another segment D. Again, anchor points with segments A en B are shown in blue and green, respectively, whereas anchor points with segment C are shown in red. Note that segment D has only two (segments A and C) or three (segment B) anchor points with each segment in the profile individually but a total of six anchor points with the profile as a whole.


