
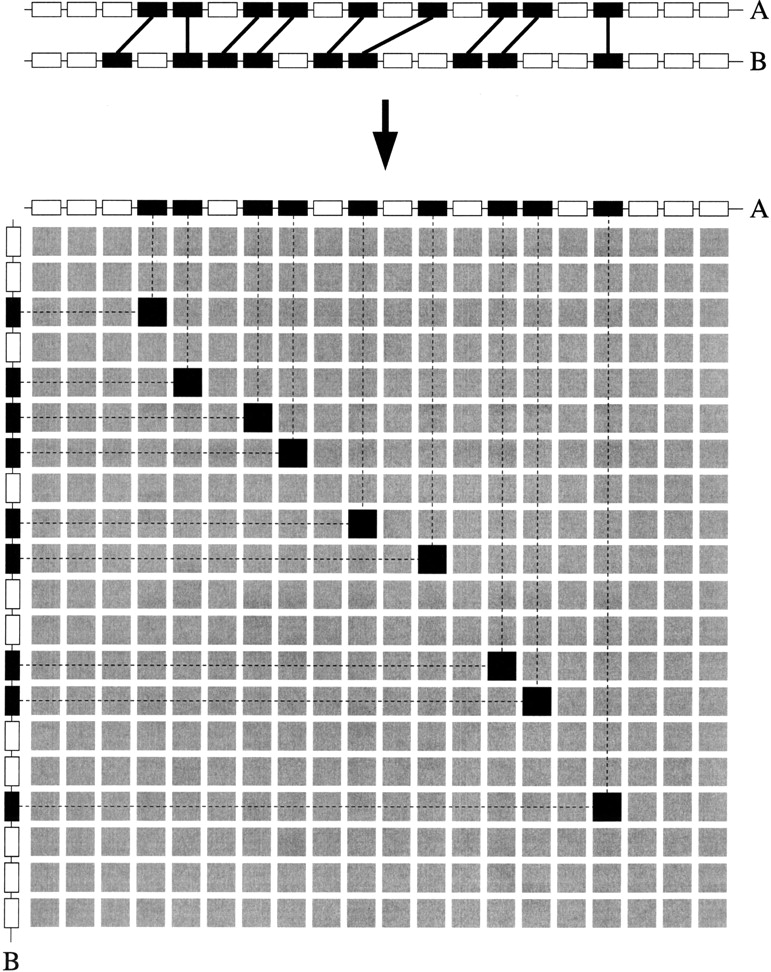
Figure 1
Construction of a gene homology matrix (GHM). The top section shows two collinear genomic segments A and B. Every box denotes a gene. The black boxes connected by lines represent pairs of homologous genes (anchor points). The bottom section shows the actual GHM derived from these two segments. Every column represents a gene of segment A, whereas every row corresponds to a gene of segment B. A cell will contain a nonzero value (i.e., is marked in black) if the gene products of the corresponding row and column are homologous to each other.


