
Figure 5
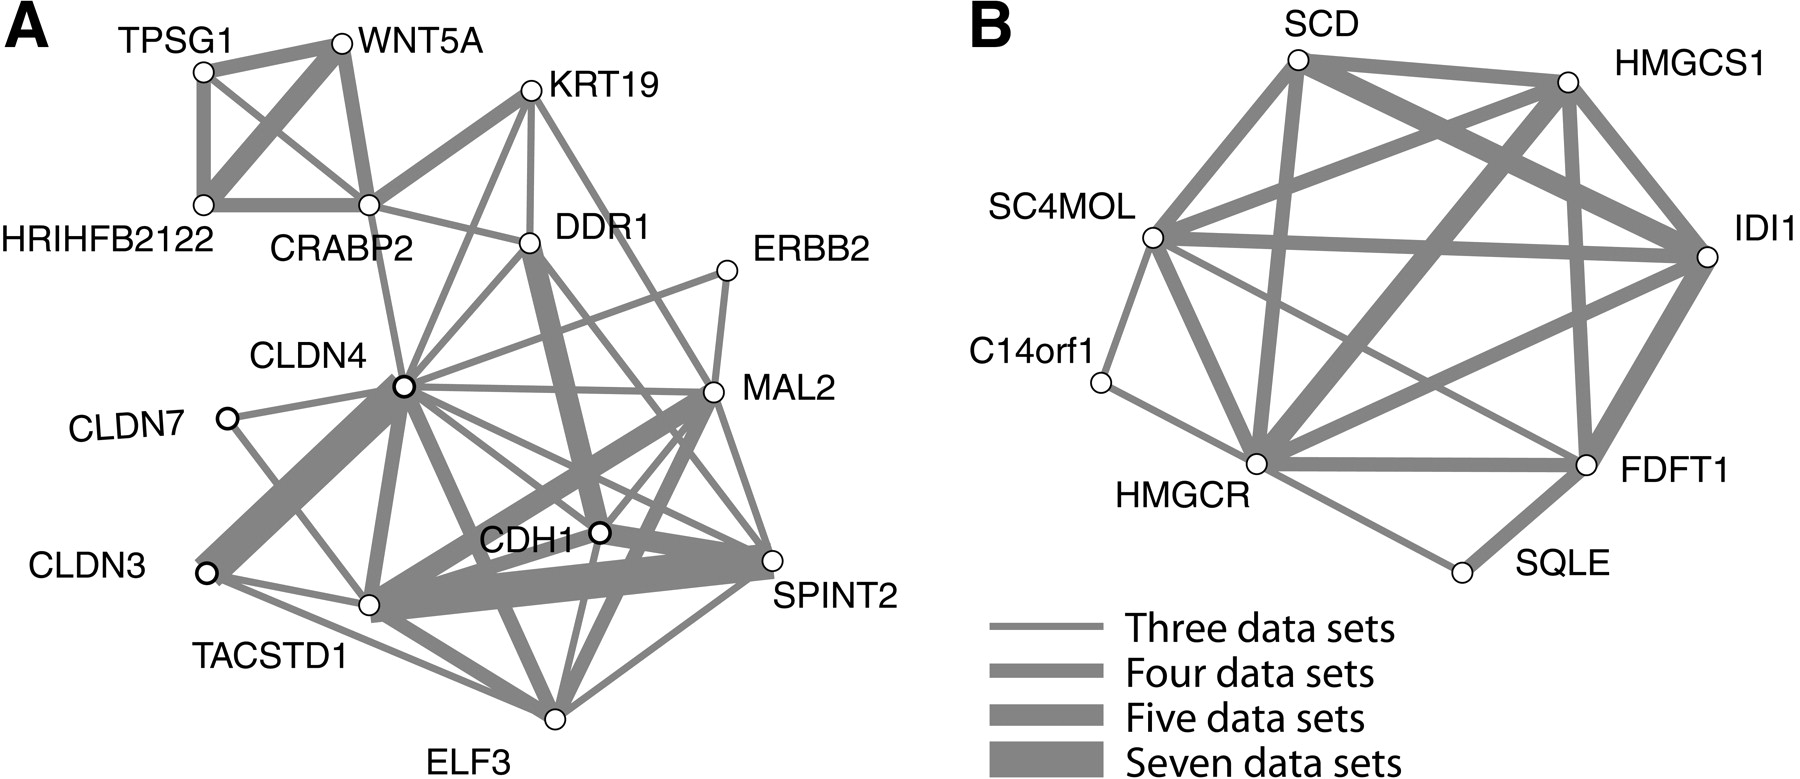
Examples of clusters extracted from the 3+ network with MCODE. See text for details. Increasing thickness of lines denotes increasing numbers of data sets in which the link was observed.
(Downloading may take up to 30 seconds. If the slide opens in your browser, select File -> Save As to save it.)
Click on image to view larger version.
Examples of clusters extracted from the 3+ network with MCODE. See text for details. Increasing thickness of lines denotes increasing numbers of data sets in which the link was observed.
 CiteULike
 Delicious
 Digg
Digg Facebook
 Google+
 Reddit
 Twitter
