
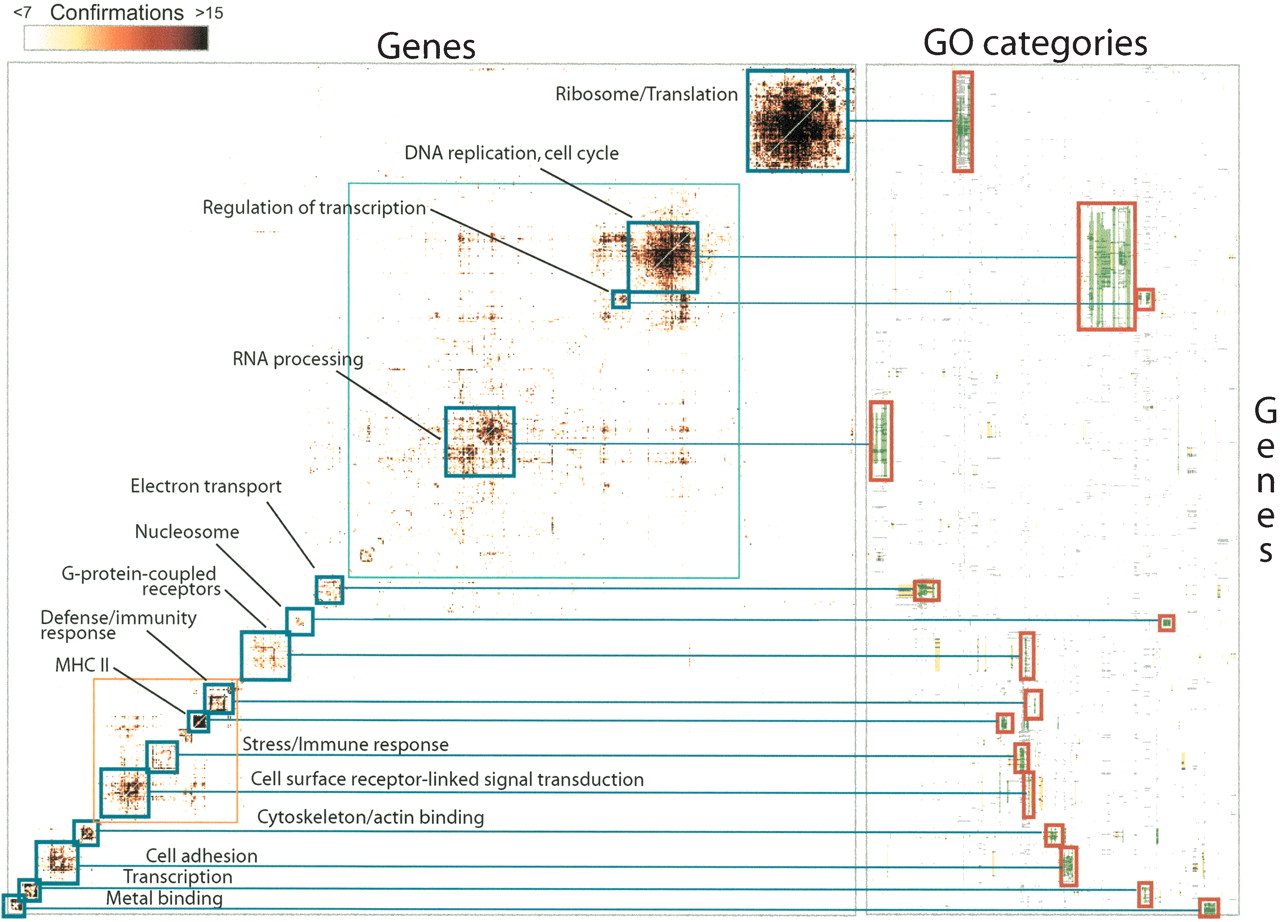
Hierarchical clustering of the coexpression network at a high level of confirmation. The left-hand side of the figure is the (diagonally symmetric) interaction matrix for 506 genes. Each color-coded entry is an interaction that is seen in seven or more data sets. The colored boxes indicate the main clusters, which are labeled according to their functional theme. A light blue box indicates a large diffuse cluster that dominates the upper half of the figure. A second box (orange) indicates several immune system-related clusters that are placed near each other. Blue lines connect many of the smaller clusters to the right-hand side of the figure, which depicts GO annotations for the same genes. On the right-hand side, each column represents a different GO term. The columns (495 GO terms) were arranged by hierarchical clustering, placing terms with similar annotation patterns together. The entries of the matrix are colored according to the status of the cluster-GO term association for the gene and term (see Methods). Green indicates term-cluster associations that were significant. Dark gray indicates the best GO term-gene cluster associations but that did not meet all criteria. Light gray points indicate GO terms-gene combinations that were not associated with a high-scoring cluster. These groups were used to define the cluster labels in the left half of the figure.


