
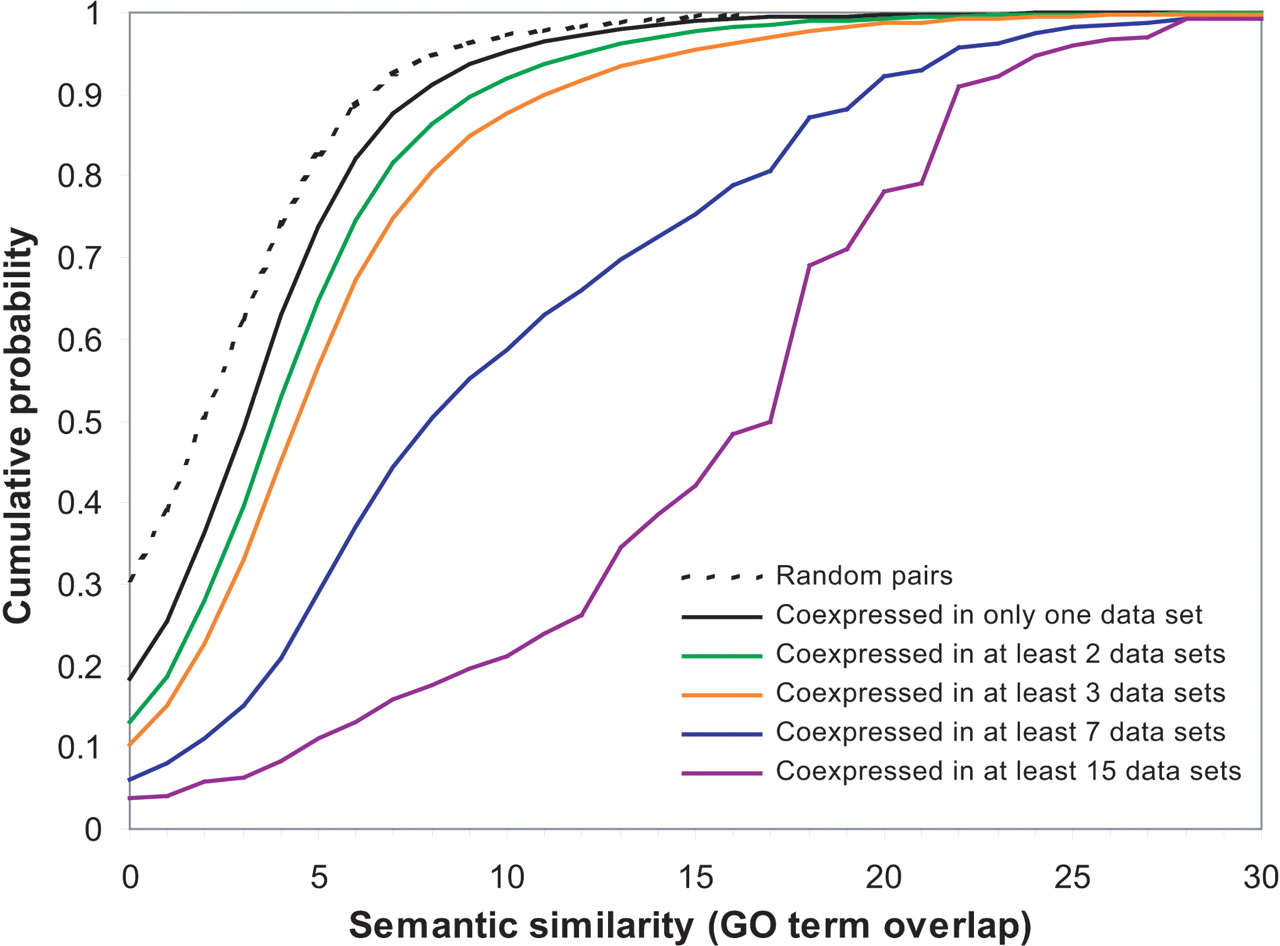
Relationship between link confirmation on semantic similarity of the selected genes. The x-axis indicates GO term overlap (see Methods). The cumulative distributions of semantic similarity scores for sets of links selected by different criteria are plotted. The dashed line indicates the distribution for randomly selected pairs of genes. Each solid curve is the cumulative probability distribution measured for pairs of genes identified by coexpression links at varying levels of confirmation (including both positive and negative correlations). The black curve is the distribution for coexpression pairs that are not confirmed. Confirmed links tend to have higher levels of GO term overlap. The x-axis is truncated at 30 (there are only 694 2+ pairs with more than 30 terms in common; the maximum is 95, for one pair).


