
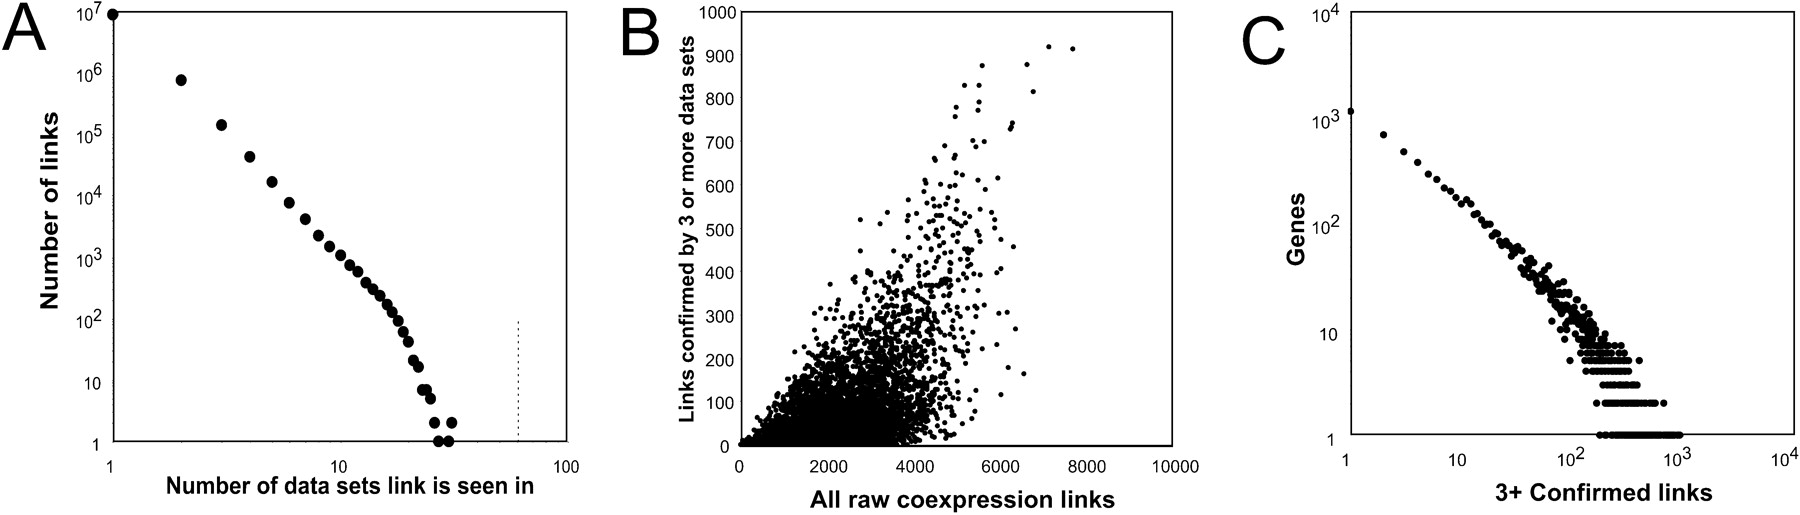
Figure 2
General properties of coexpression confirmation in the database. (A) Distribution of links at different levels of confirmation. The vertical dashed line marks the total number of data sets analyzed (60). Most links are not confirmed, but some links are confirmed in up to 31 data sets. (B) The number of “raw links” (those that are confirmed or not) plotted against the number of links that are confirmed in at least three data sets. Each point represents one gene. Genes with many raw links tend to have more confirmed links. (C) Degree distribution of links confirmed in at least three data sets.


