
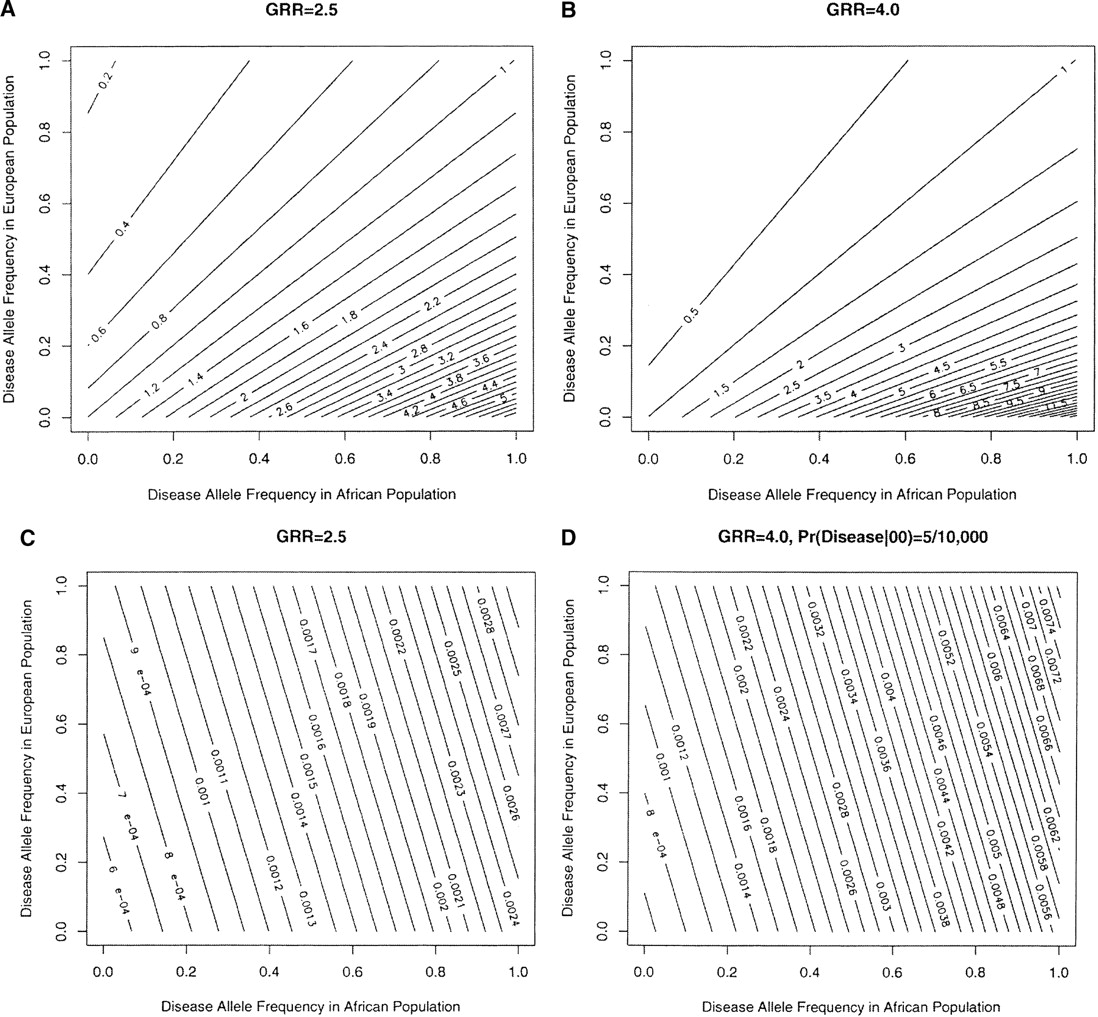
Figure 4
Contour plots show the relationship between genotypic risk ratio in the admixed population and disease allele frequencies in two parental populations. In panel A (GRR = 2.5) and panel B (GRR = 4.0), the contour lines show the population risk ratios corresponding to the disease allele frequencies. In panel C (GRR = 2.5) and panel D (GRR = 4.0), the contour lines show the disease prevalence in the admixed population attributed to the susceptibility gene as a function of the disease allele frequencies in the parental populations.


