
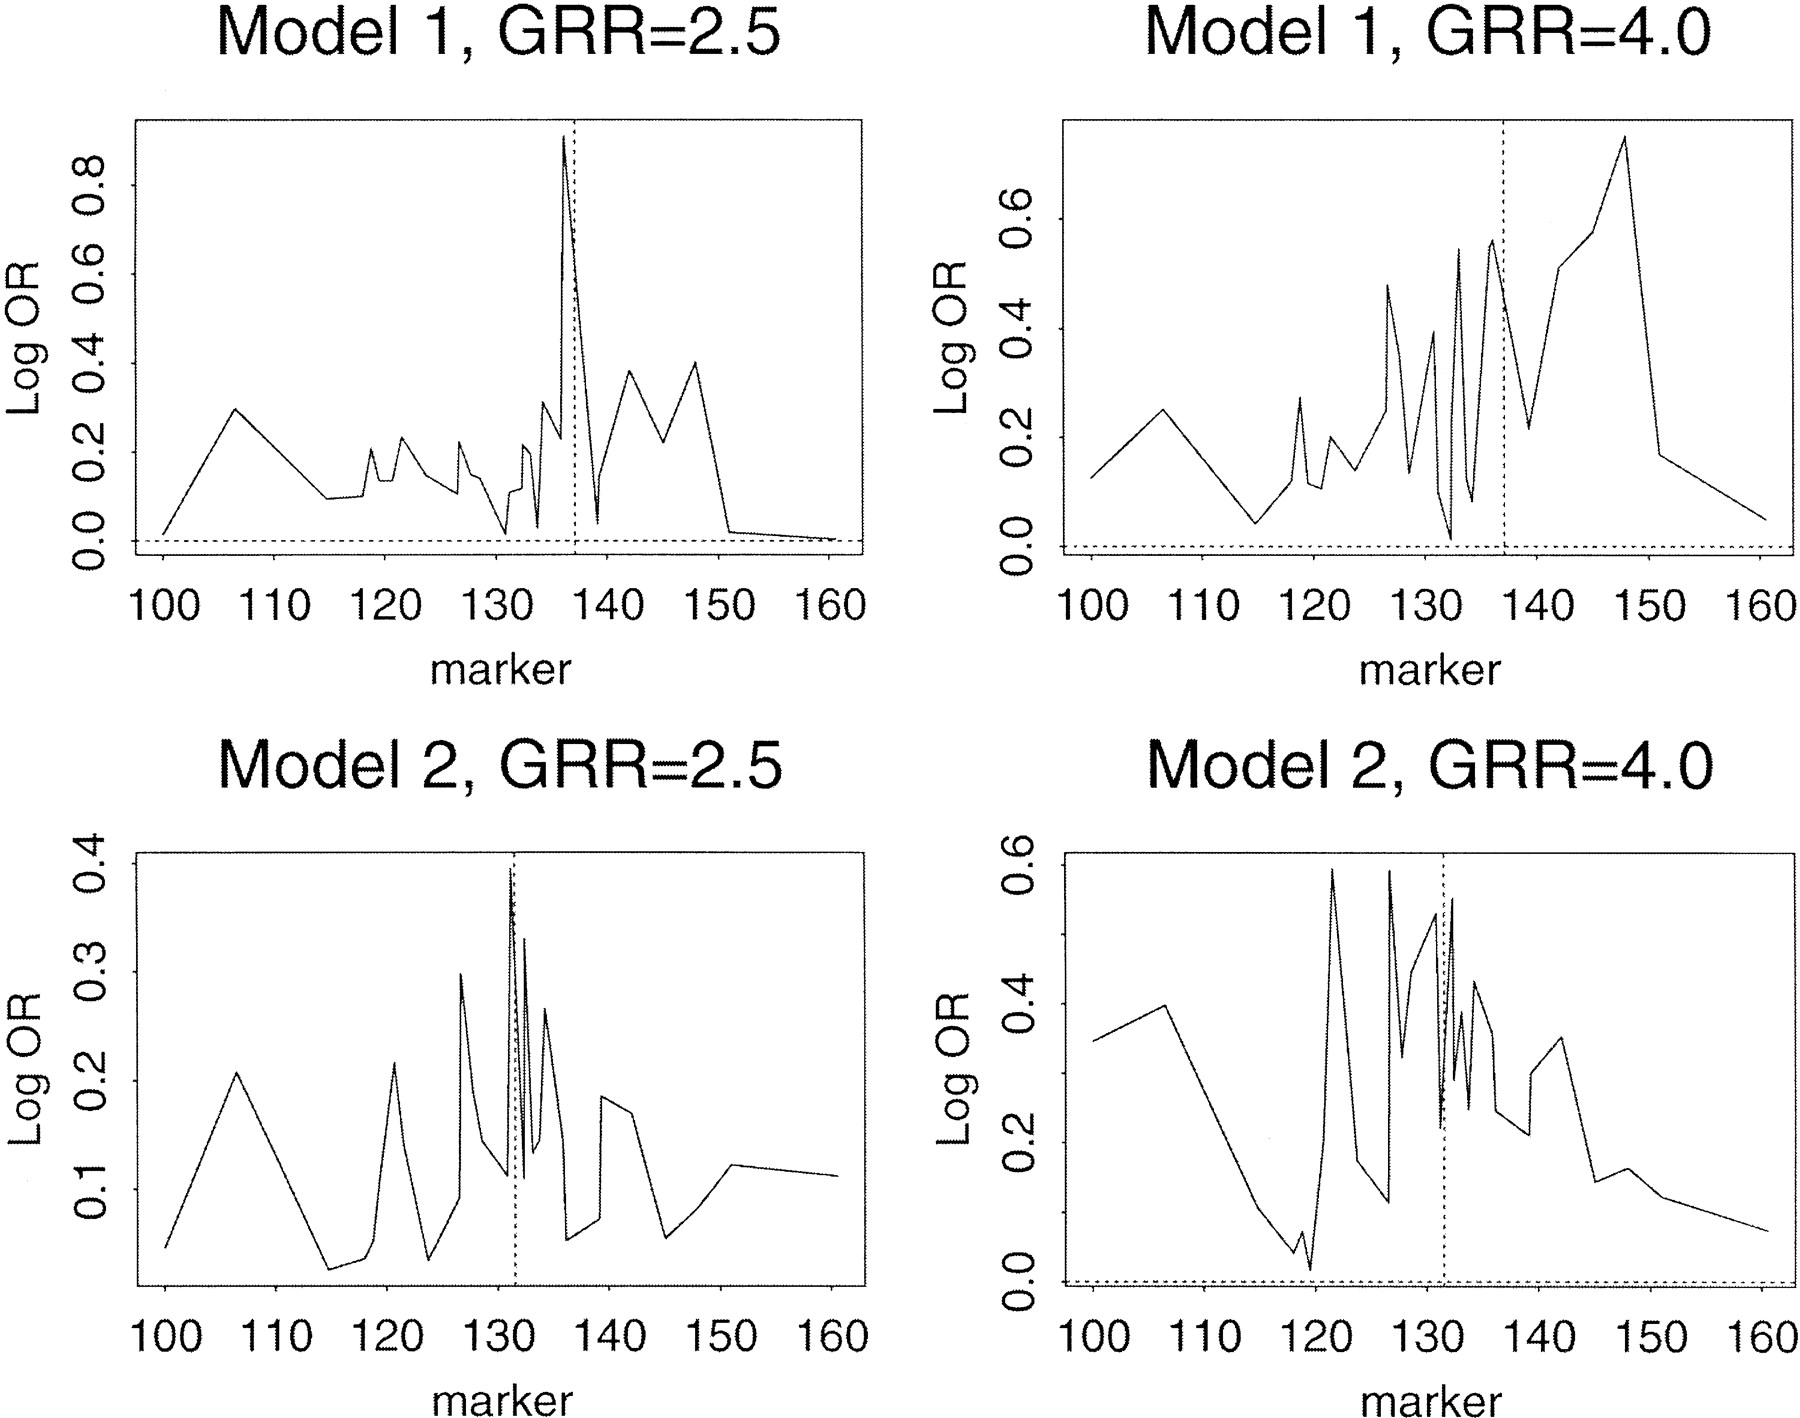
Figure 3
Log odds ratio comparing the alleles of simulated cases and controls. The panels show the results for each of the 29 markers and the same models described in Figure 2. The alleles for each marker were compared between the cases and controls for each of the models. The log odds ratio of the associated allele (either allele 1 or allele 2) is shown on the ordinate and the cM position on the abscissa. The position of the markers used for model 1 and model 2 are as indicated by the vertical dashed line.


