
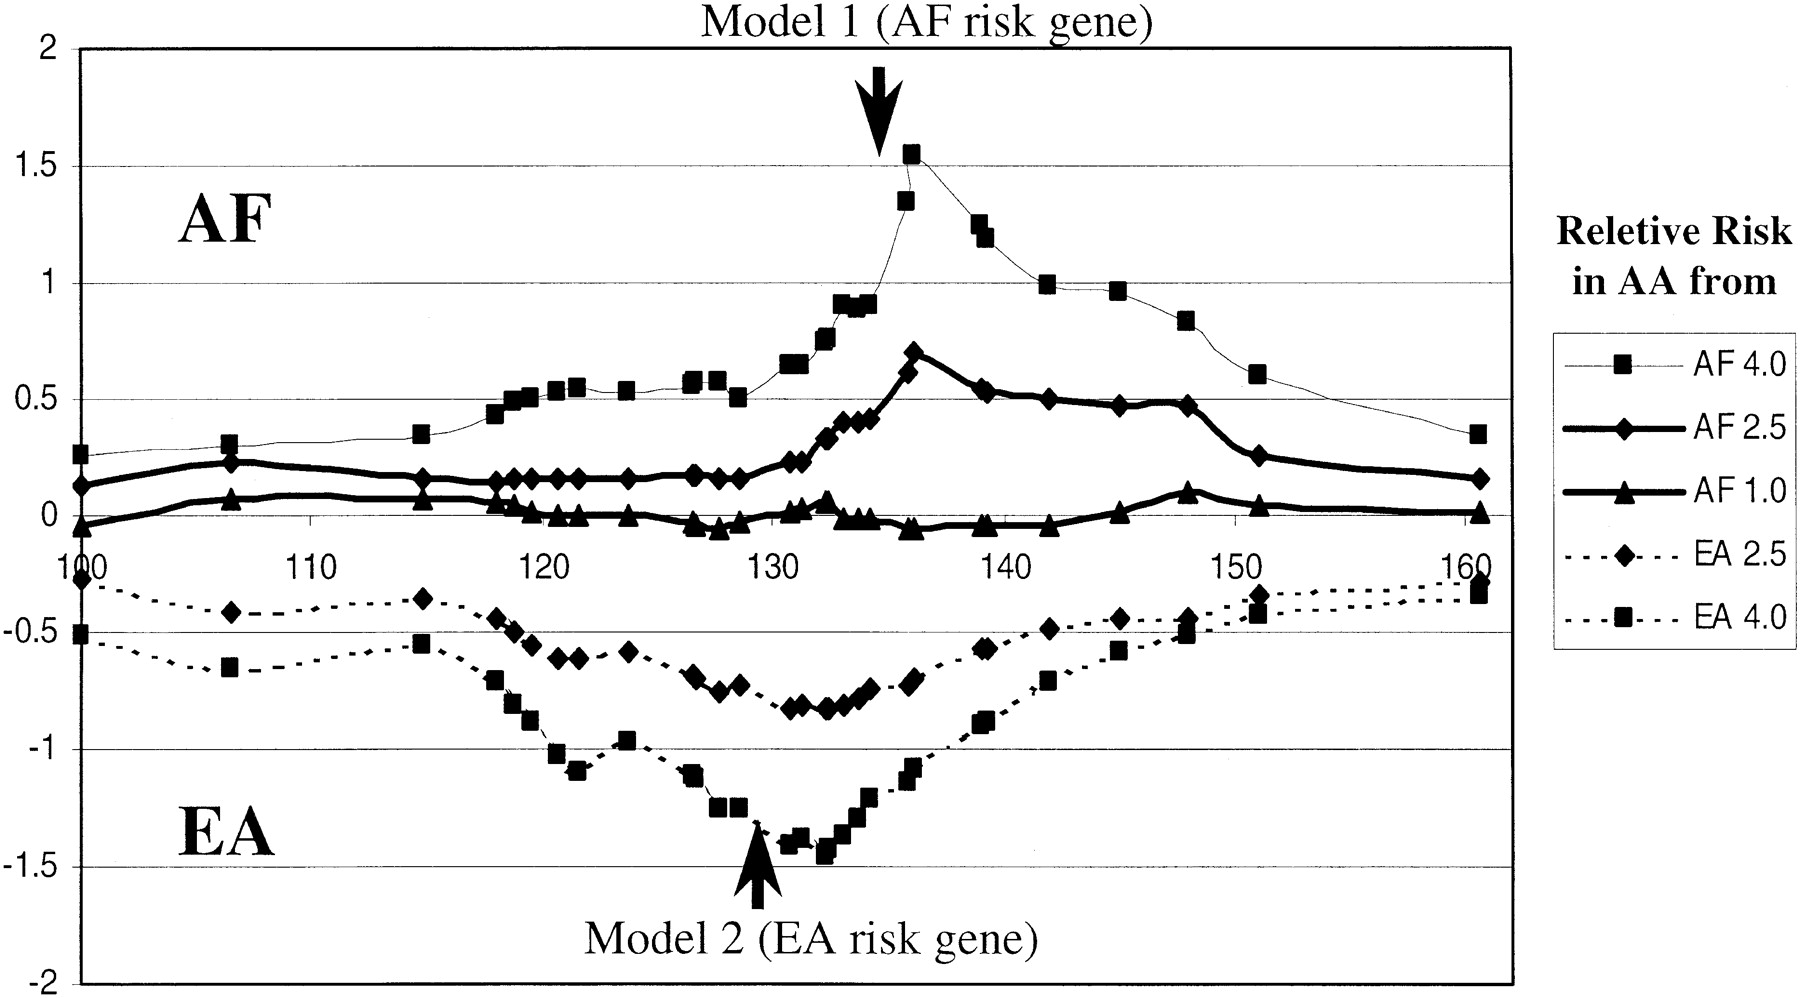
Plot of the ancestry probability for both AF and EA susceptibility gene models for a segment of chromosome 5 in AA subjects. The Ln of the probability AF versus EA ancestry is shown on the ordinate and the cM position on the abscissa. The arrows indicate the position of the modeled susceptibility loci, and the symbols and graphs correspond to the relative risk models shown in the legend. The data were derived from results of 268 AA genotyped with 31 diallelic EA/AF AIMs. Two of the markers in the interval were used for determining the cases and controls for each model according to relative risk set for the AA population. These two markers were not included in either the subsequent haplotype or ancestry estimations; 500 cases and 500 control subjects were generated from the 268 typed individuals to conform to the various risk models using a computational algorithm set to the inheritance model and based solely on the two selected markers. The haplotypes of each sample group were estimated by using PHASE (Stephens et al. 2001). The haplotypes of cases and controls for each model were then analyzed together with haplotypes estimated from 90 AF and 90 EA subjects for the locus-by-locus estimation of population ancestry using the program STRUCTURE, version 2.0 (http://pritch.bsd.uchicago.edu/software/readme/readme). The Ln of the ratio of the probability that each locus on each haplotype in each individual was derived from either AF or EA was determined for each sample set and used to calculate the mean probability in each sample set. The confidence levels for identification of the modeled susceptibility genes in each model are discussed in the text.


