
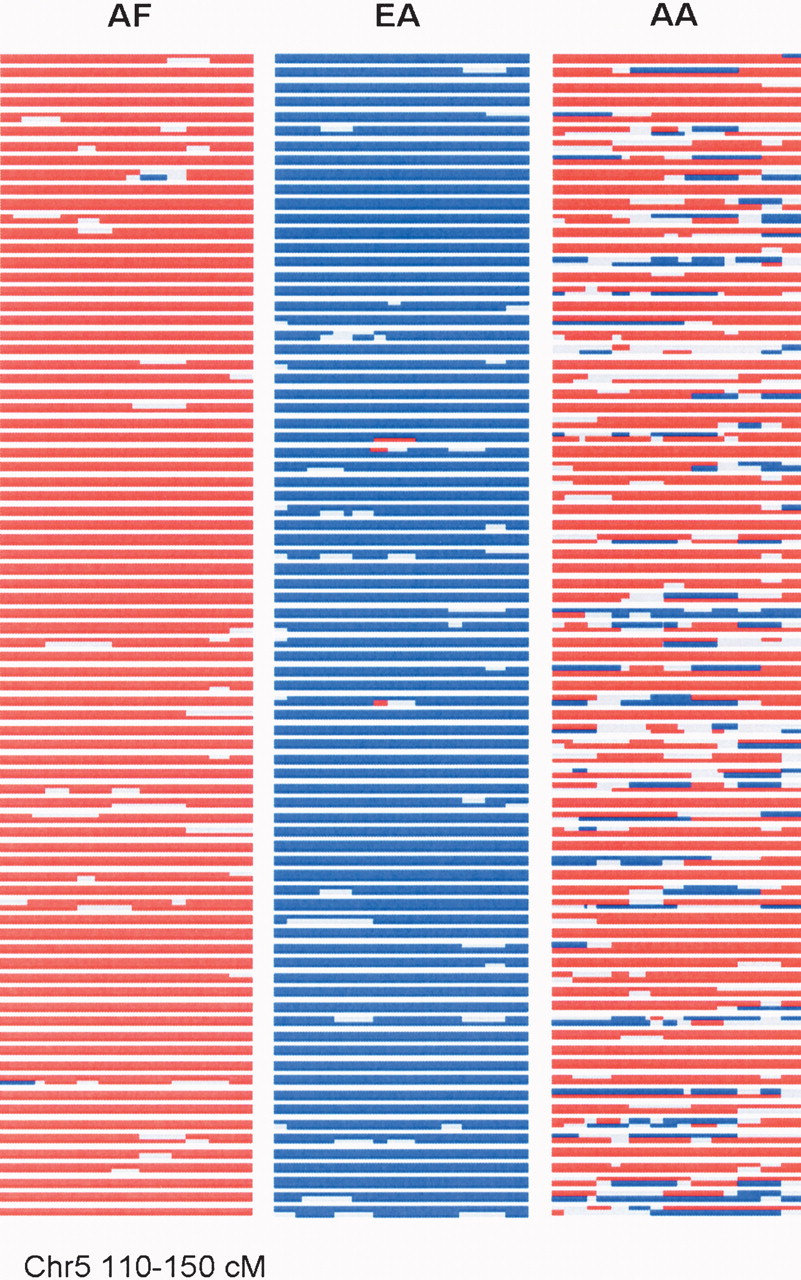
STRUCTURE analysis of a 40-cM segment of chromosome 5 in EA, AF, and AA. The calculated probable ethnic origin for both chromosomes of 80 subjects from each population on each chromosome is shown with proportional segment length. Chromosome pairs are depicted with spaces between individual subjects. The Ln of the ratio of the probability that each locus on each haplotype in each individual derived from either AF or EA was determined for each individual and coded as red (Ln AF/EA > 2.0), blue (Ln AF/EA < –2.0), or gray lines (LN AF/EA < 2.0, > –2.0). The data shown is from a 40-cM region (110–150) that is derived from the analysis of a 61-cM segment (100–160.6) region using 268 AA, 90 AF, and 90 EA subjects for the locus-by-locus estimation of population ancestry using the program STRUCTURE, version 2.0. The 80 subjects graphically depicted were chosen randomly. The central 40 cM is shown because the ancestry assignments for the ends of the examined segment are less certain. For these analyses, STRUCTURE was run under the linkage model by using 50,000 burn-in and 50,000 replications, with K = 2, phased data, and infer-α.


