
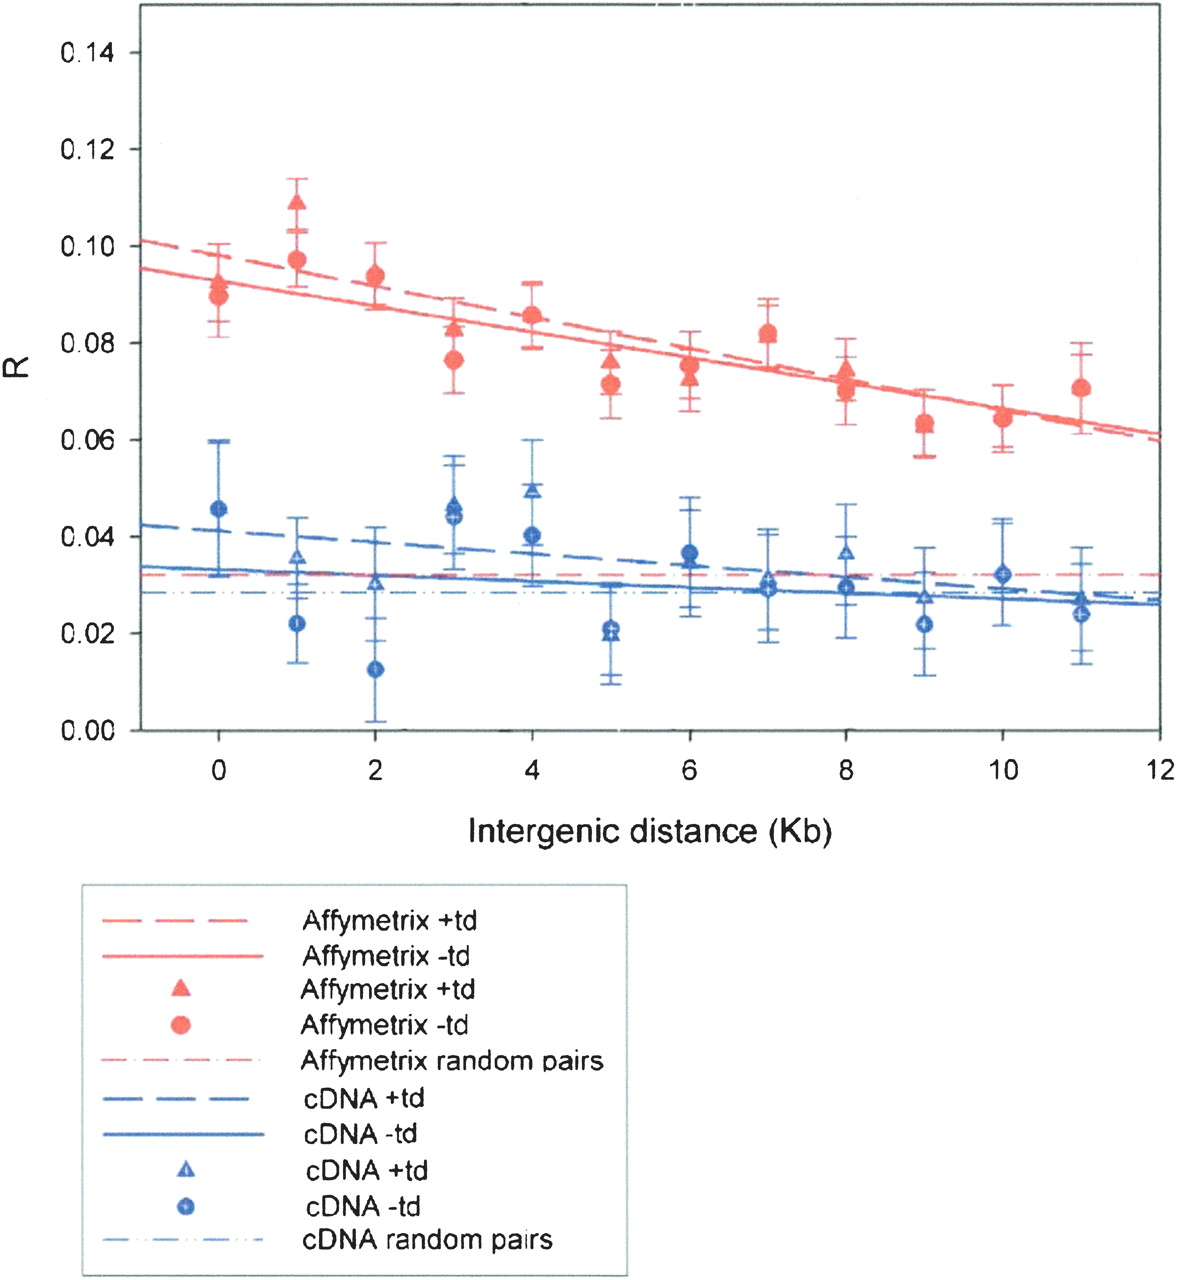
Gene pairs up to 12 kb apart were binned according to their intergenic distance for both the data set containing and lacking tandem duplicates. The Mean R for all pairs within each bin was calculated using the cDNA microarray data and the Affymetrix data. (Red) Results obtained using Affymetrix data set; (blue) results obtained using cDNA microarray data. Data points using triangles are those obtained including tandem duplicates; circles indicate results obtained after removal of tandem duplicates. The regression lines are plotted, full lines those with all genes included, dashed lines those without tandem duplicates. Also plotted is the mean R value for all gene pairs (dashed lines with dots).


