
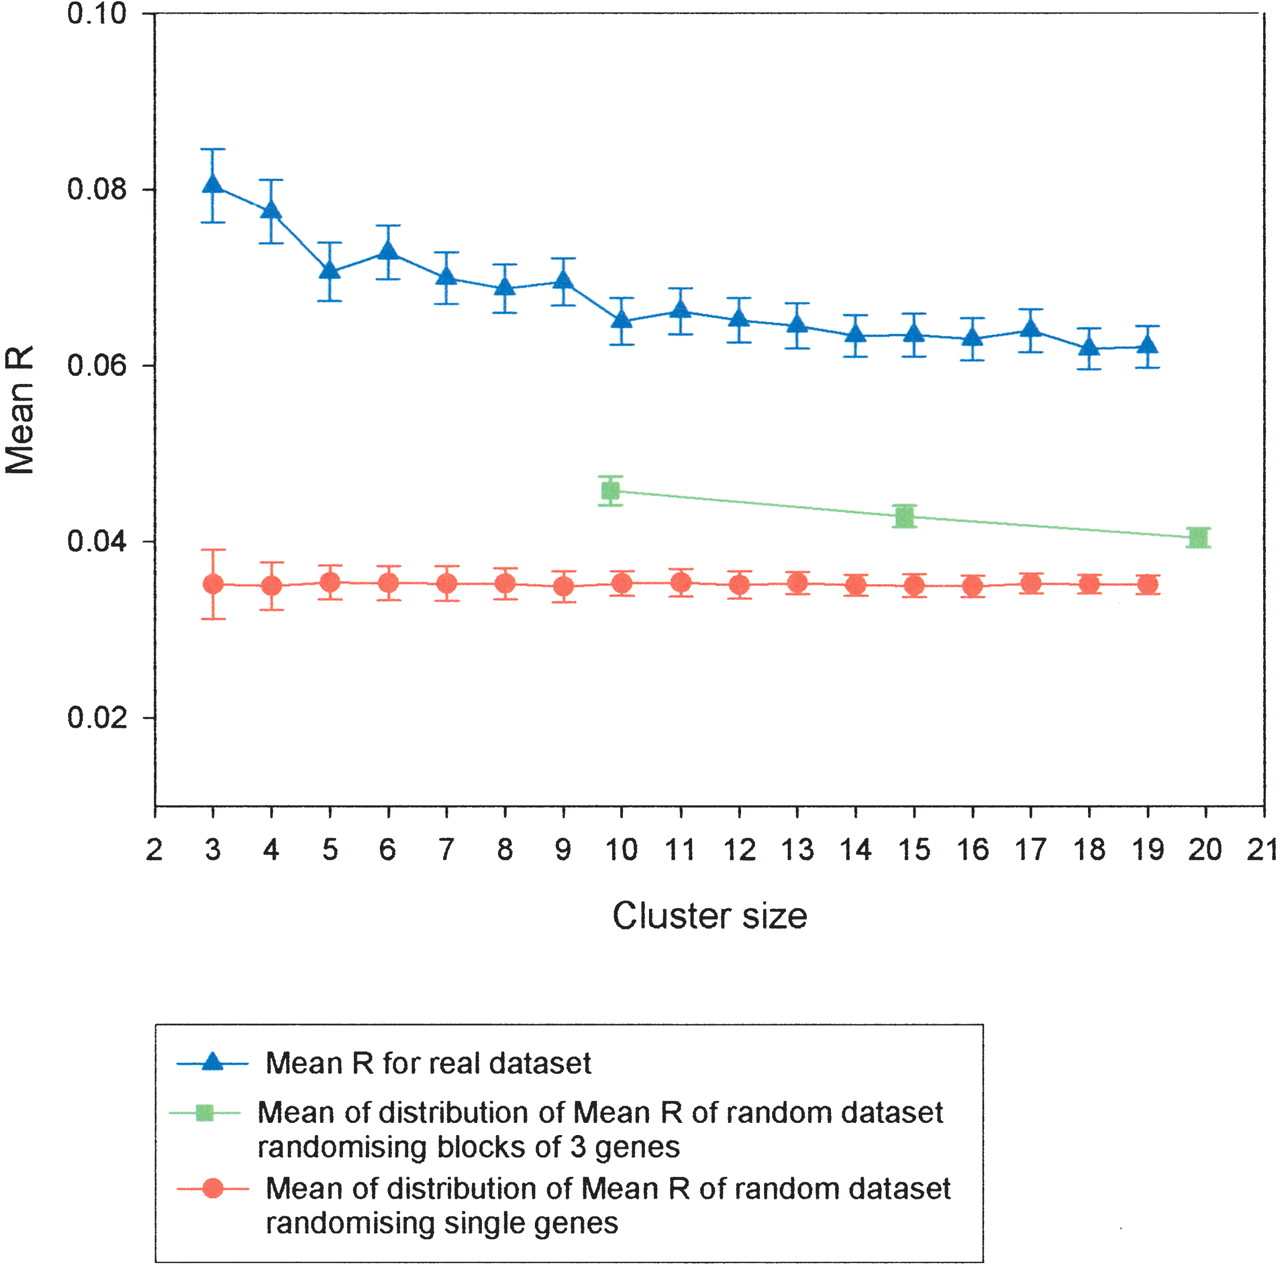
Figure 2
Using the Affymetrix data set lacking tandem duplicates, the mean R for nonoverlapping windows of neighboring genes (three to 20 genes in size) was plotted against cluster size (blue line). The Mean R from 100 random sets of gene clusters (three to 20 genes in size) was also plotted (red line).


