
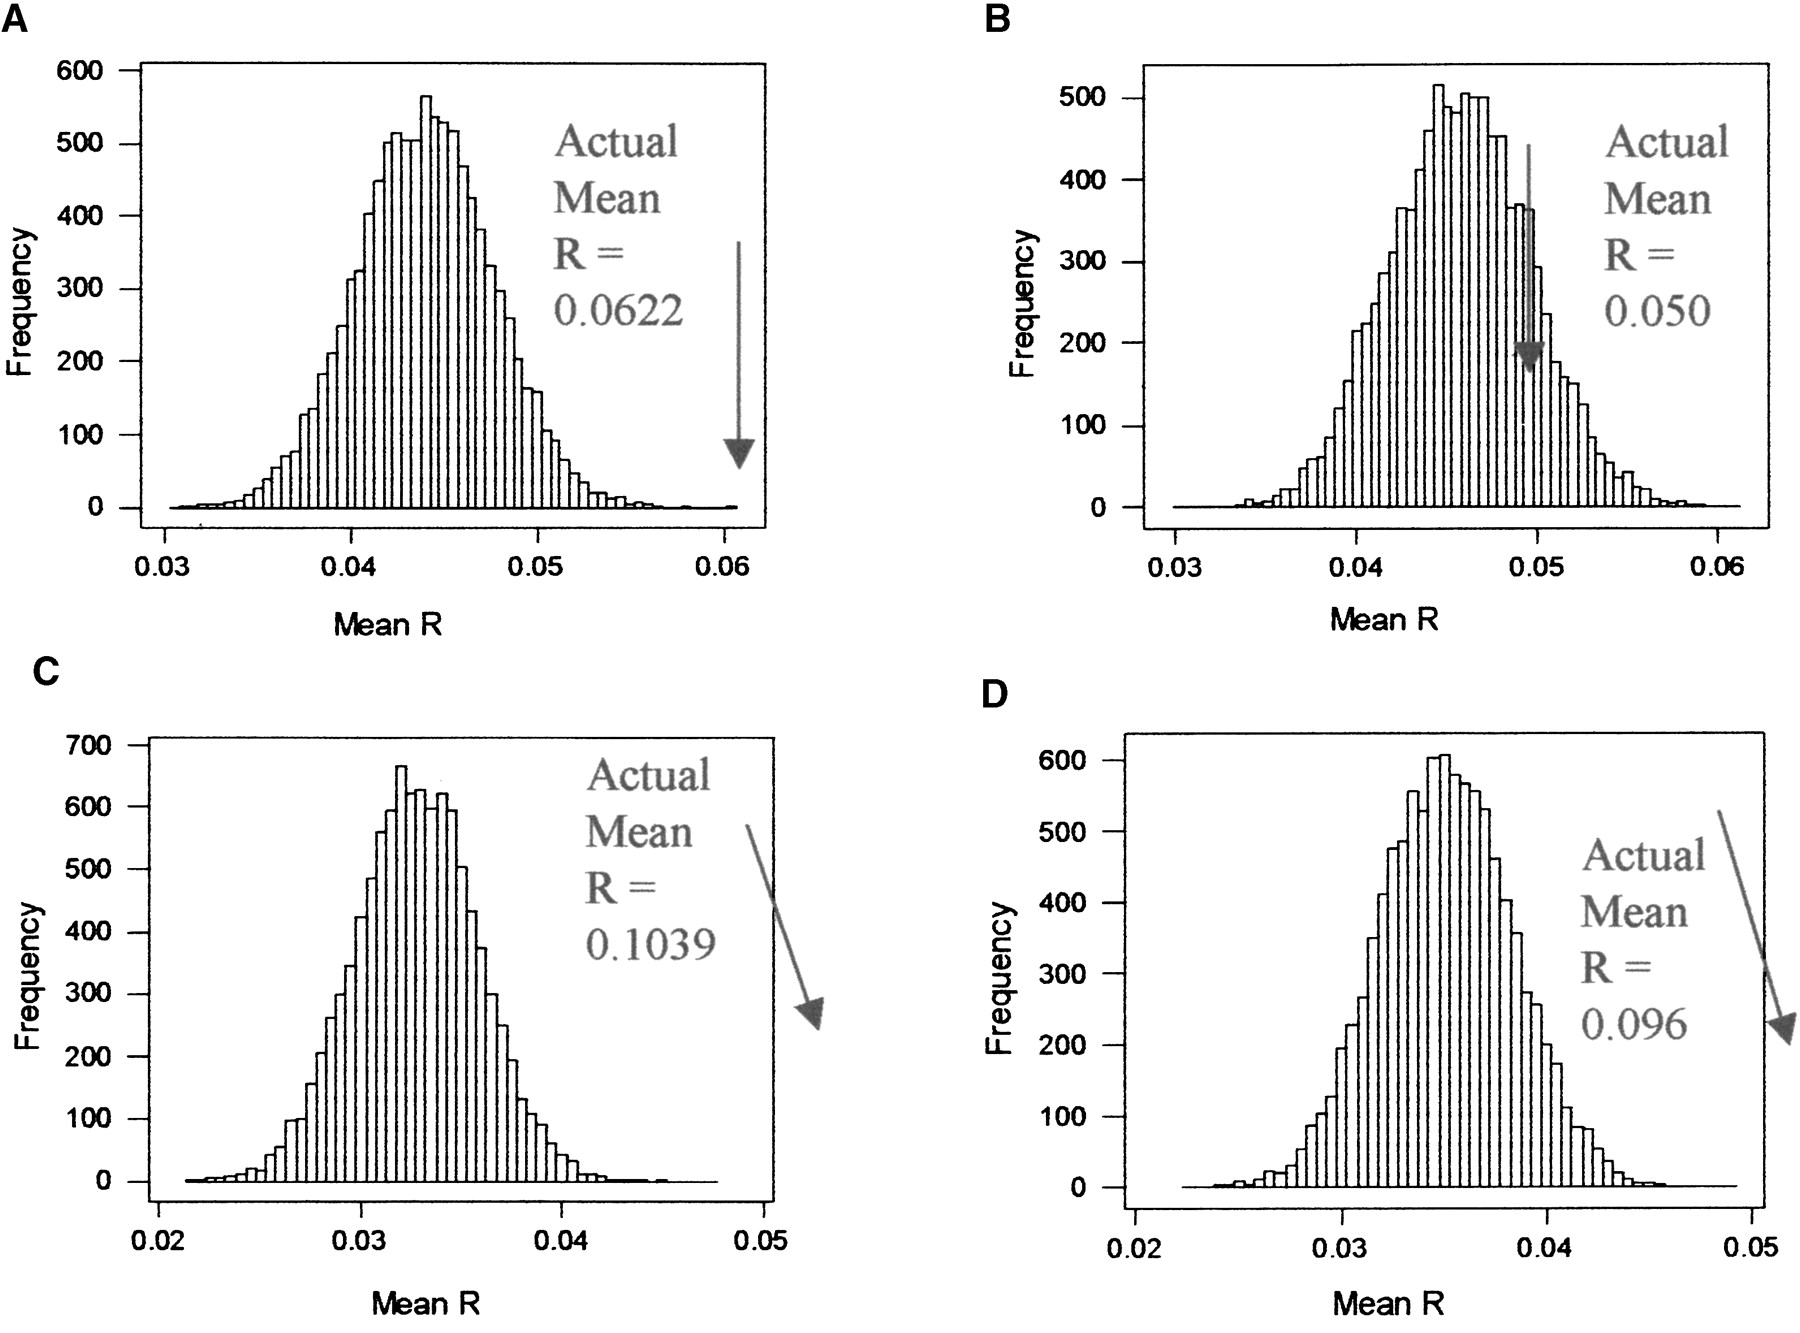
Histogram of mean R generated from 10,000 randomized pairs of genes. For each randomized genome, the mean R of pairwise comparisons was calculated. The Mean R calculated from the original set of neighboring gene pairs is marked with an arrow. For both data sets, including tandem duplicates, there was a significant degree of coexpression of neighboring pairs. After the removal of tandem duplicates only, the Affymetrix data set showed evidence that neighboring genes were more likely to be coexpressed. (A) cDNA array including tandem duplicates. Mean R = 0.04397, σ = 0.00365. (B) cDNA array not including tandem duplicates. Mean R = 0.04574, σ = 0.00394. (C) Affymetrix array including tandem duplicates. Mean R = 0.03275, σ = 0.00307. (D) Affymetrix array not including tandem duplicates. Mean R = 0.03510, σ = 0.00328.


