
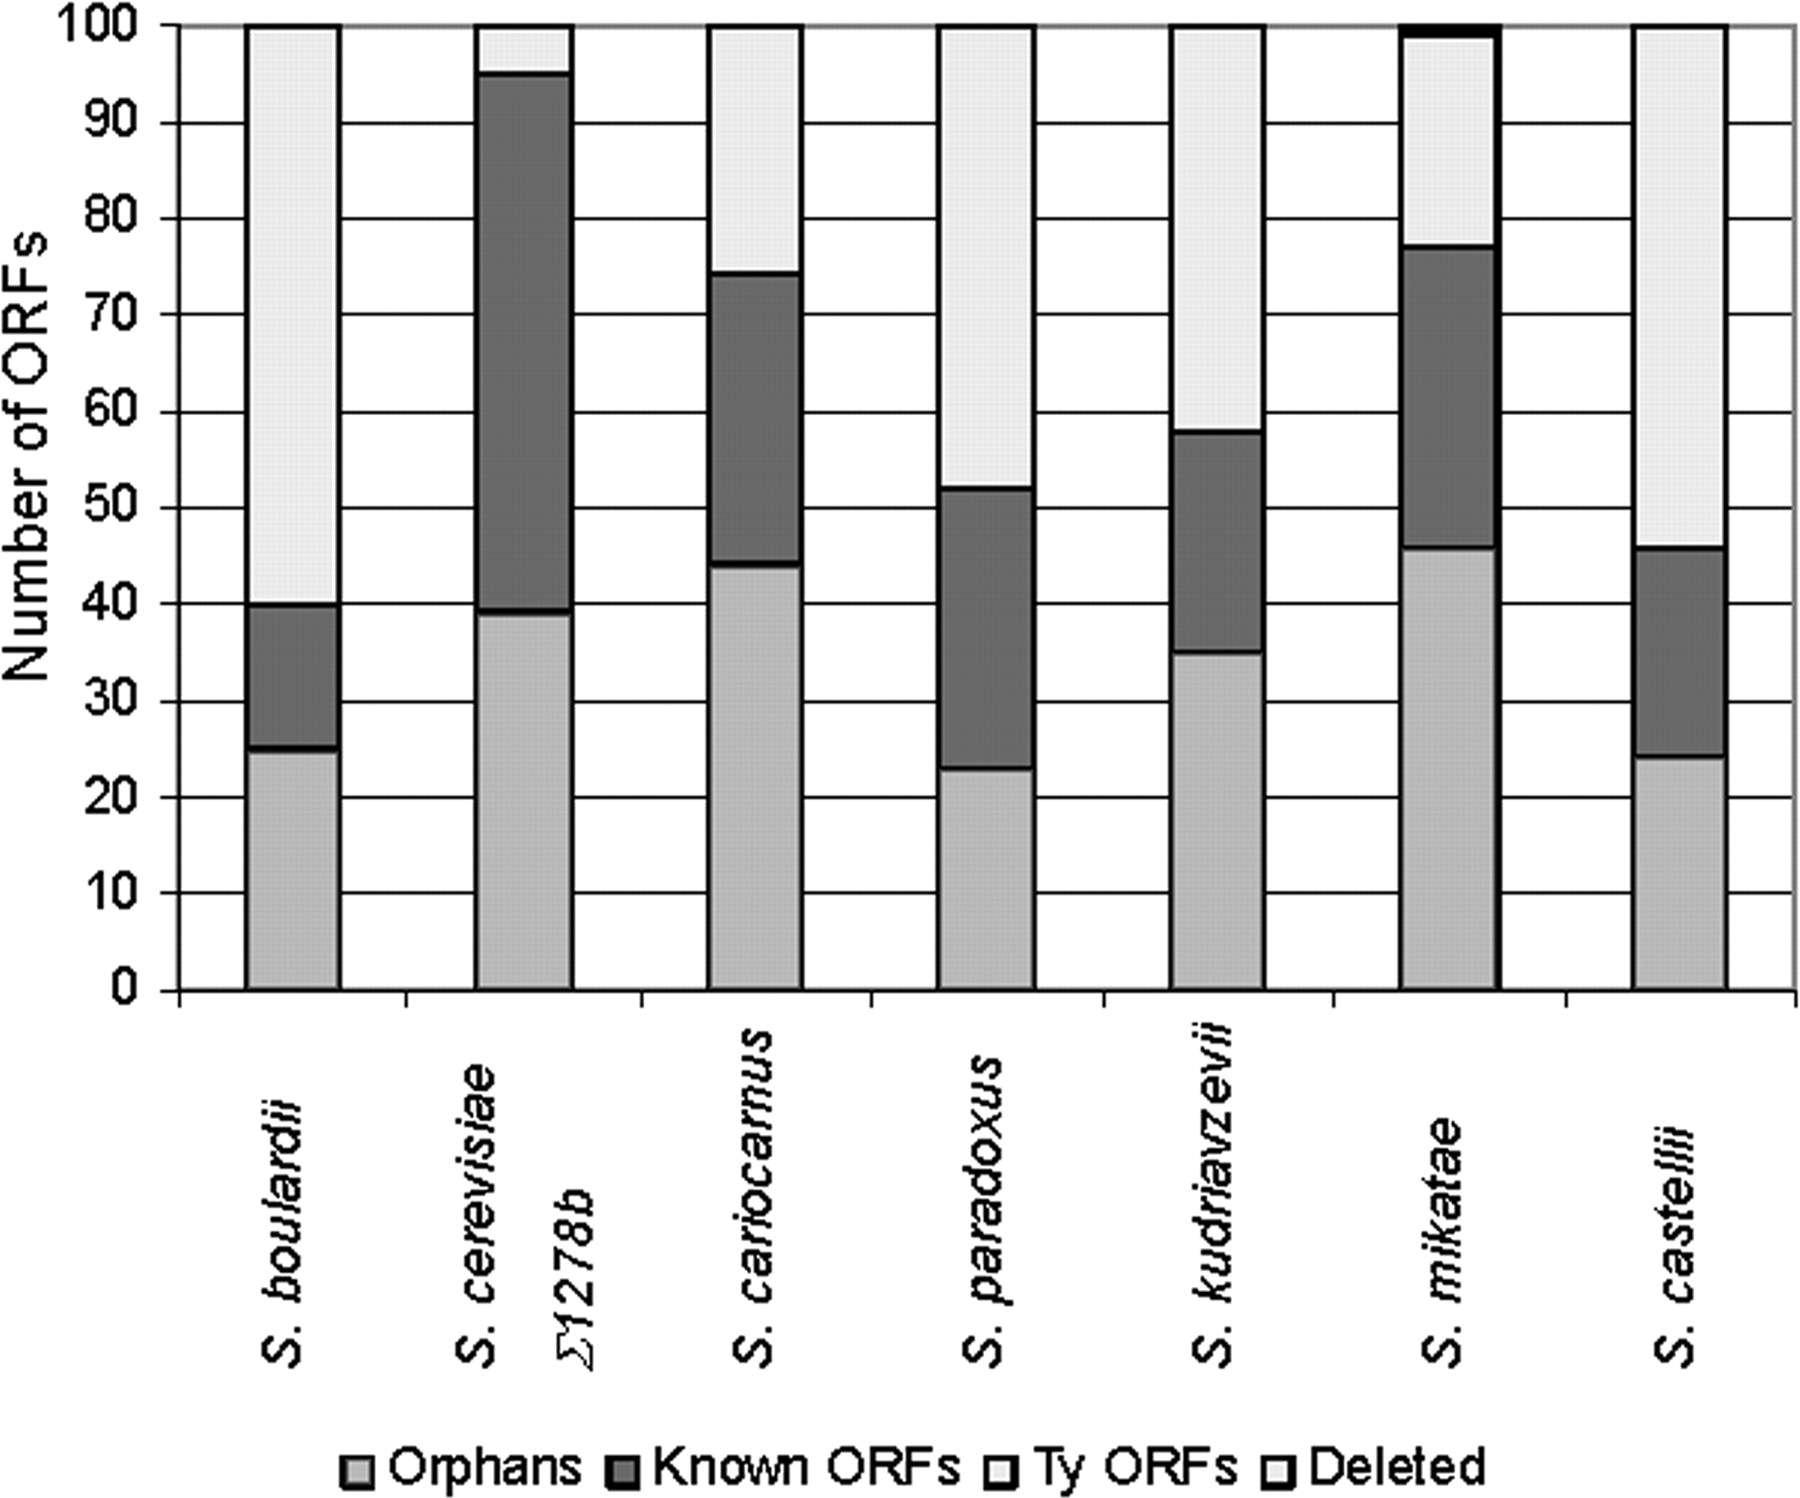
Figure 3
Distribution of the first 100 ORFs in the absent/diverged data set for each species. The histograms represent the first 100 ORFs furthest from the threshold. These ORFs fall into three main categories: known ORFs, orphans, and Ty elements.


