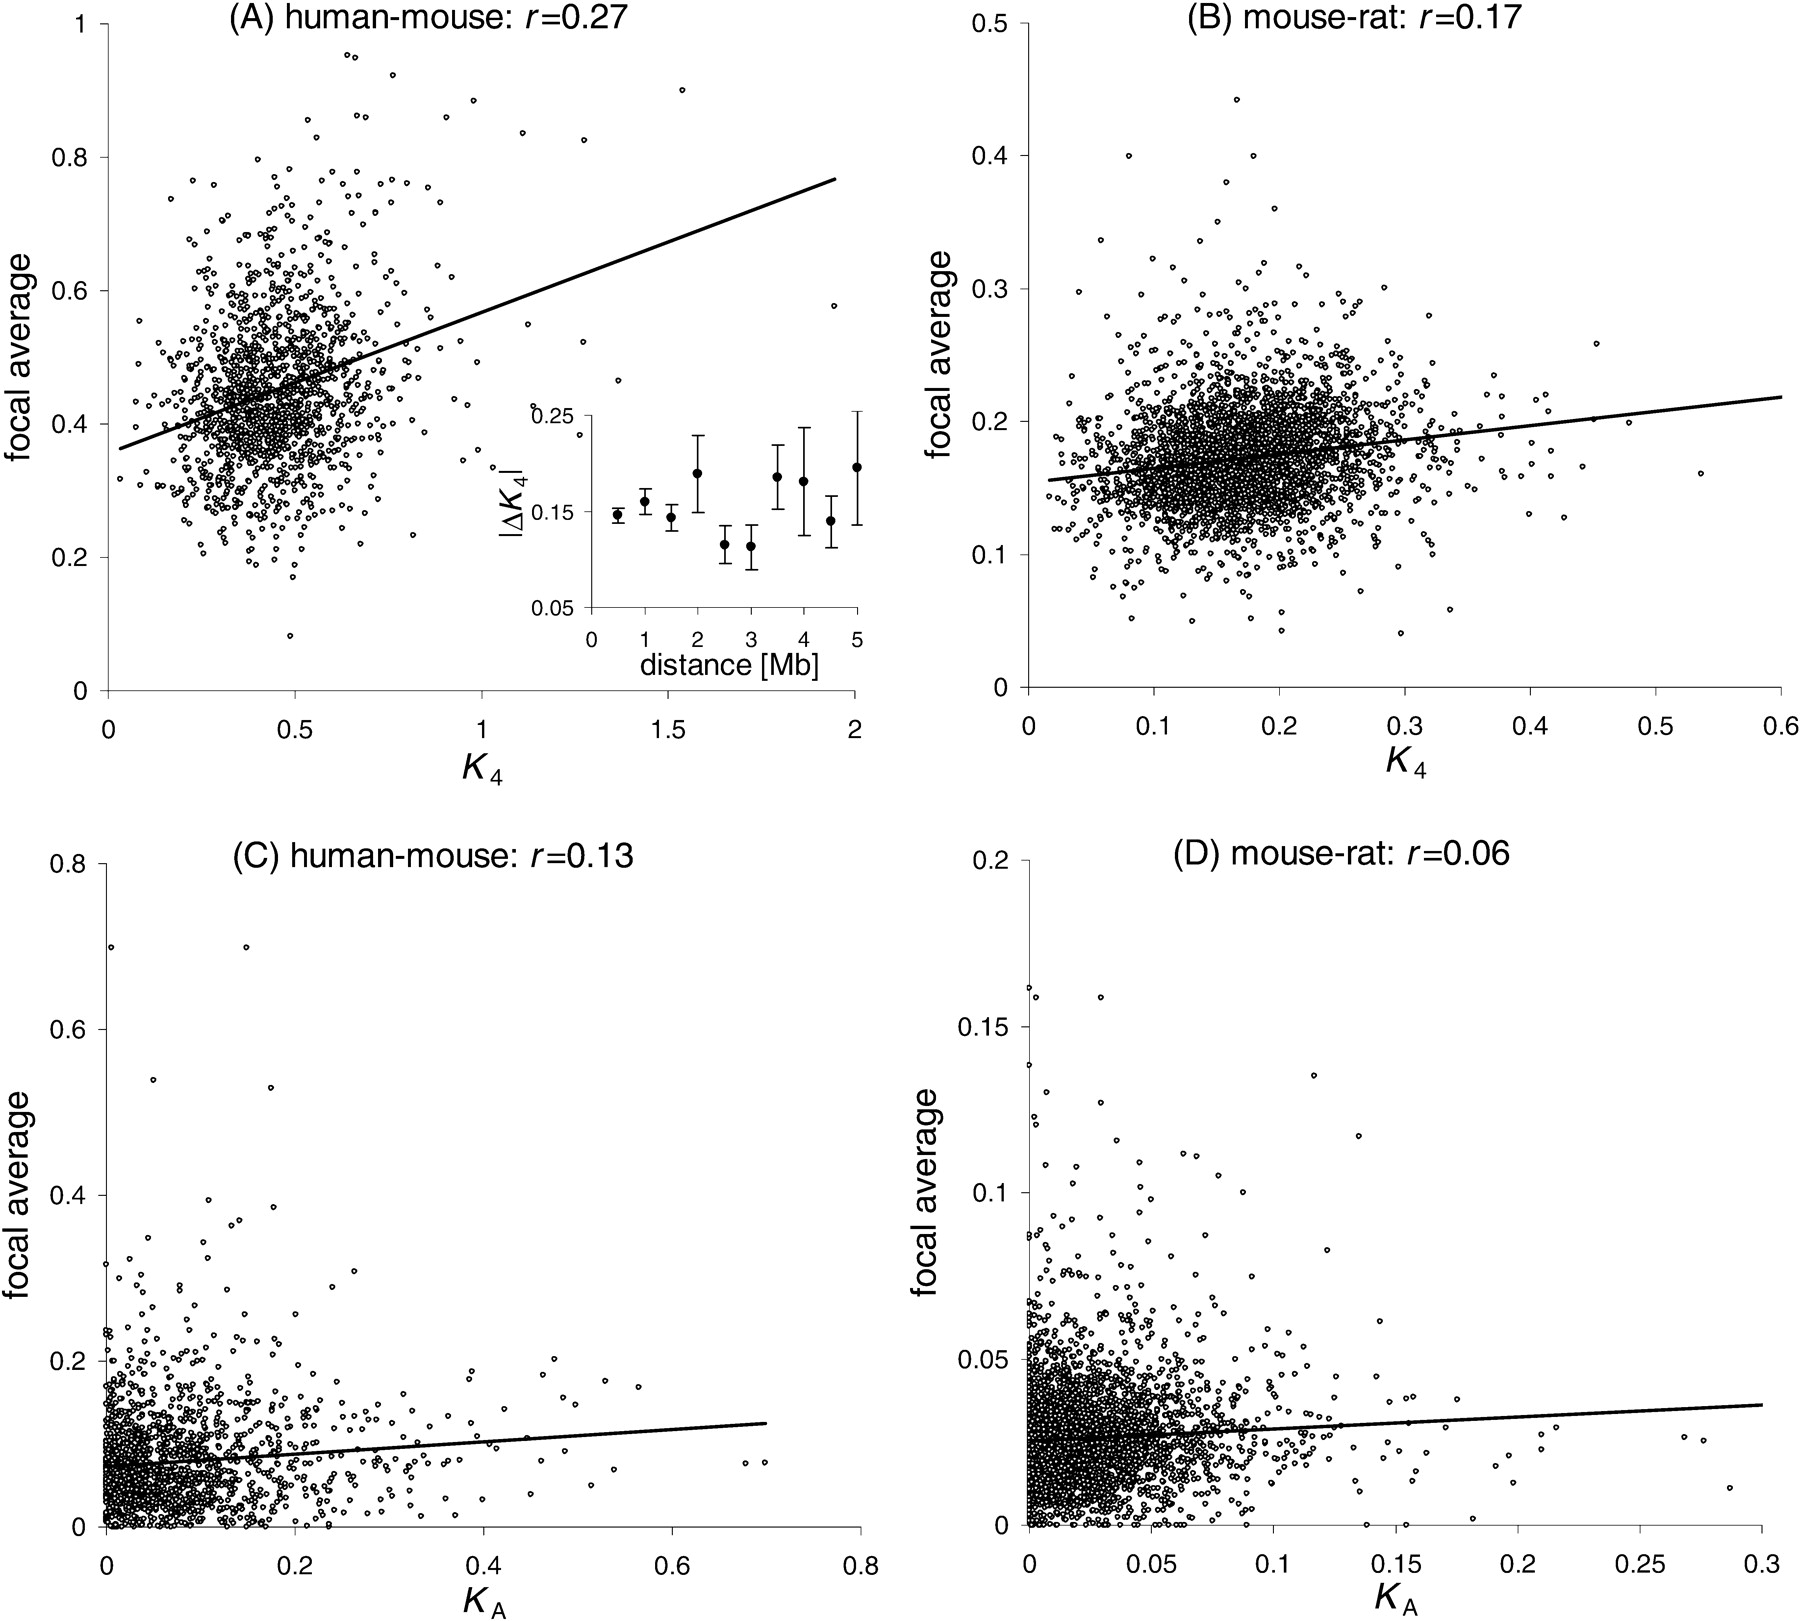
Genomic Regionality in Rates of Evolution Is Not Explained by Clustering of Genes of Comparable Expression Profile

(Downloading may take up to 30 seconds. If the slide opens in your browser, select File -> Save As to save it.)

Click on image to view larger version.

Figure 1
Figure 1

Correlation ρ between substitution rates and focal averages. For K4 (A,B), only nondisparate gene pairs are included. All correlations are highly significant (P ≤ 0.001). The inset in (A) shows an alternative measure of local similarity as used by Kumar and Subramanian (2002).

This Article

  1. Genome Res. 14: 1002-1013

Preprint Server