
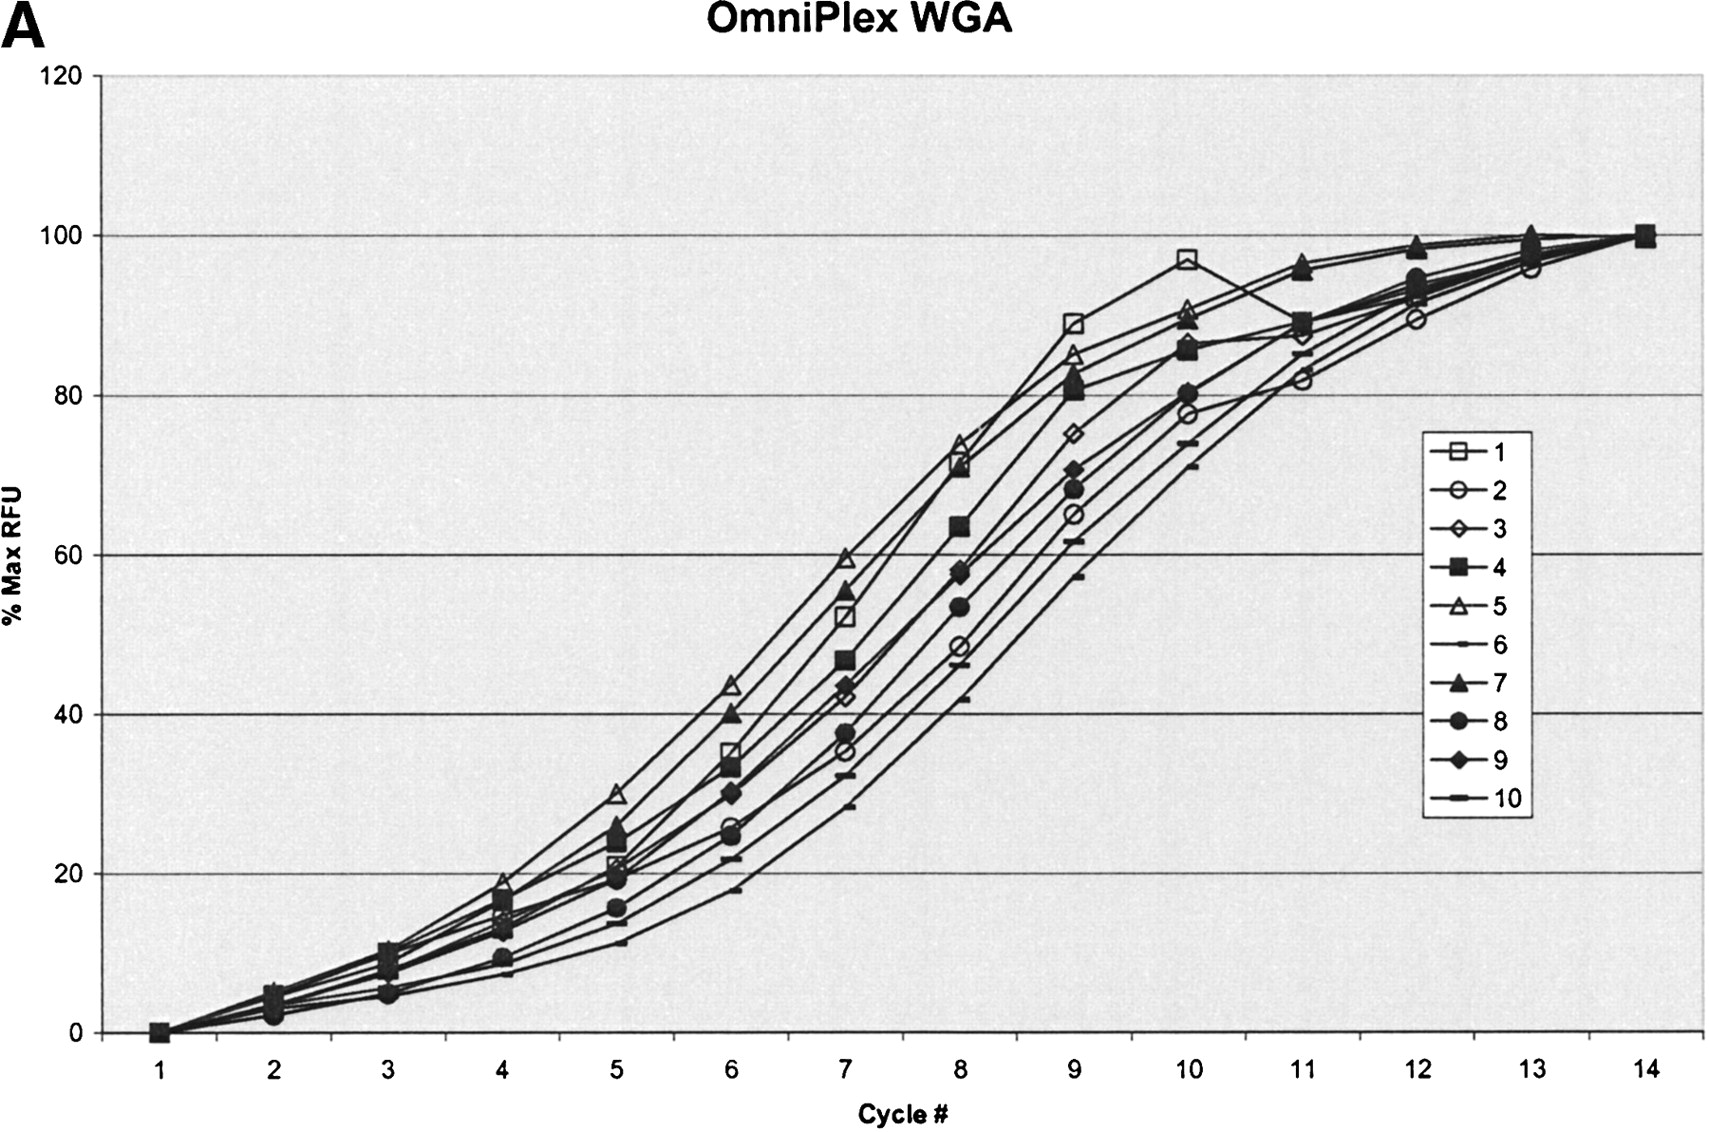
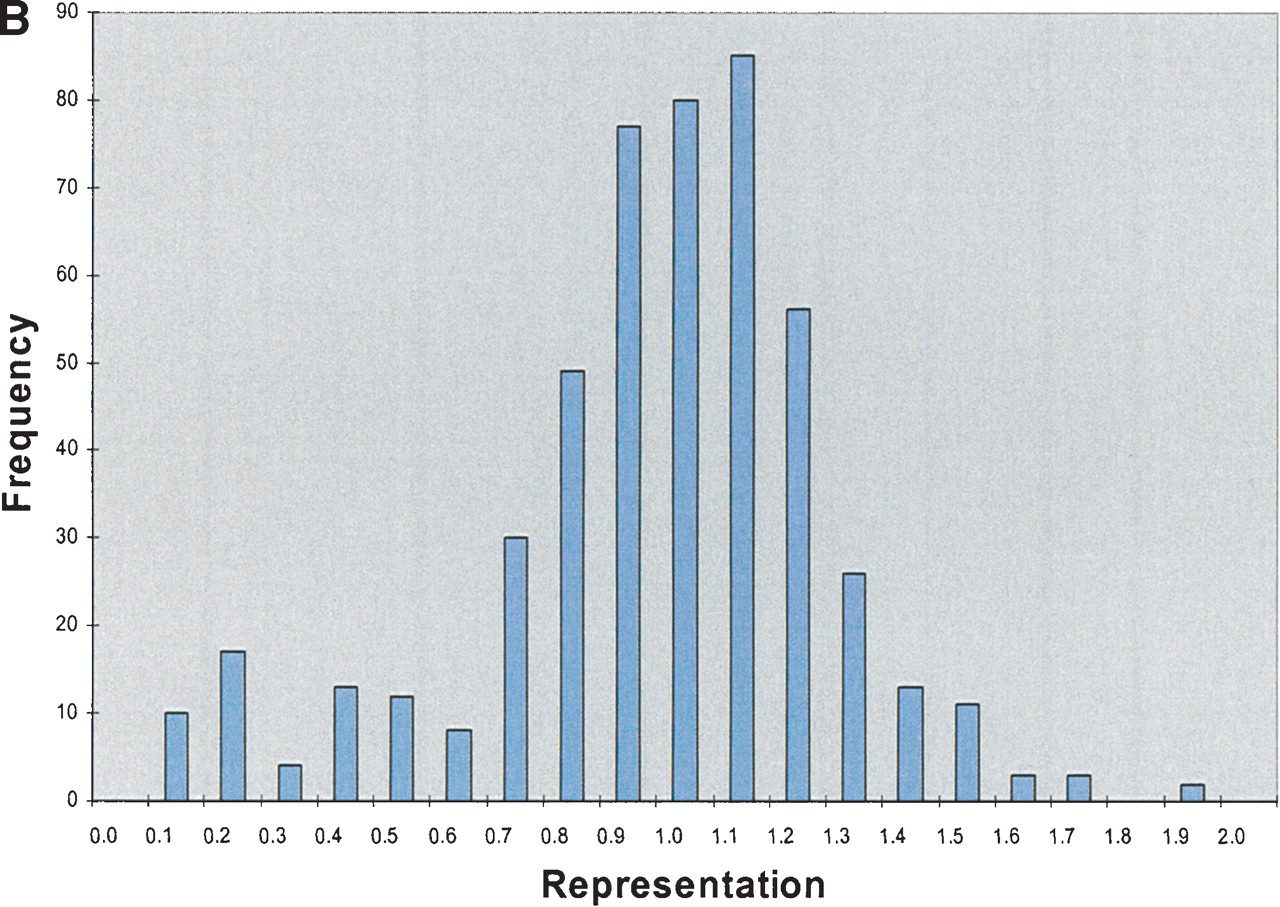
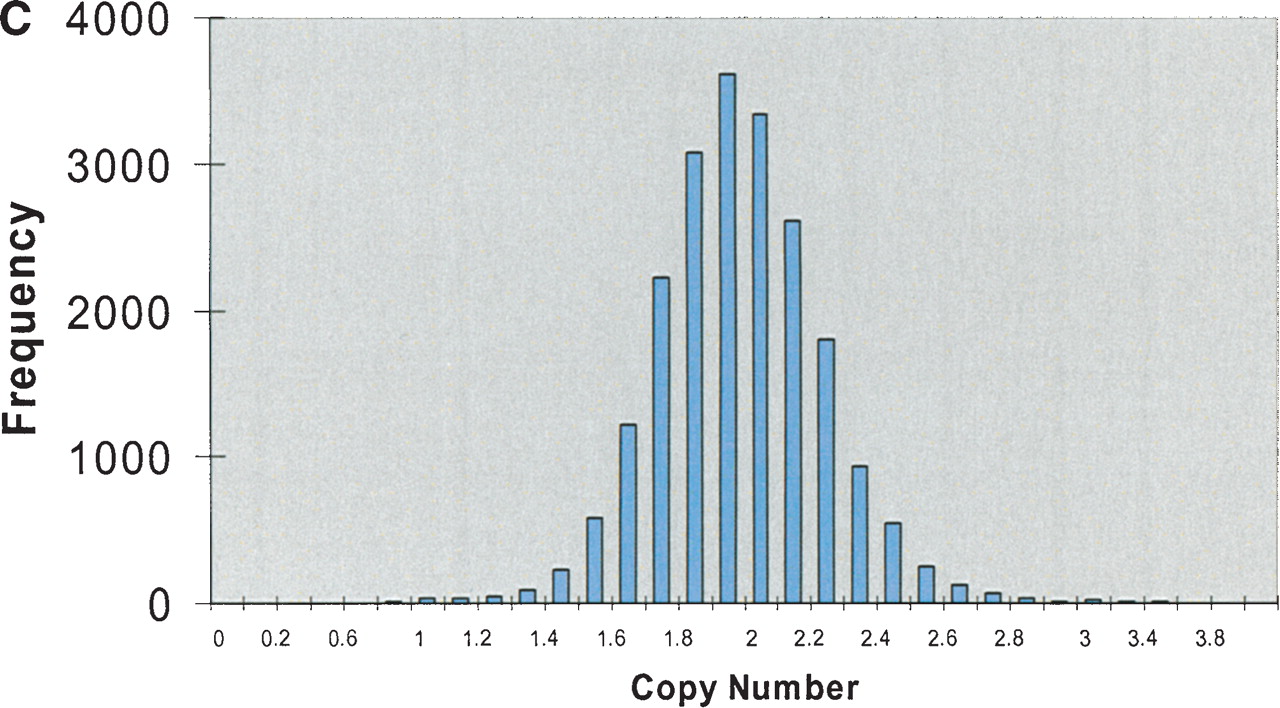
STS analysis of OmniPlex amplified DNA. (A) Amplification curves for 1 well of each of the 10 samples of DNA. Fluorescence intensities after each cycle of PCR in the Bio-Rad ICycler were normalized to the maximum intensity. Duplicate samples share the same symbol. (B) Representative histogram of the representation of 103 STS sites within all 10 of the amplified DNA samples. The value for each STS was divided by the average STS value for that sample and the representation was subsequently calculated by taking the average values for the duplicate samples. Greater than 90% of sites were within a factor of 2 of the mean amplification. The total number of comparisons was 500. (C) Histogram of ratios of each 103 STS to each other for the five different DNA sources. Duplicate samples were averaged and the values were normalized to a copy number of 2 by dividing by the average ratio for each STS pair over the 10 samples and multiplying by two. Total number of ratios is 20,930 and 95.2% of the ratios were between 1.5 and 2.5 copies.


