
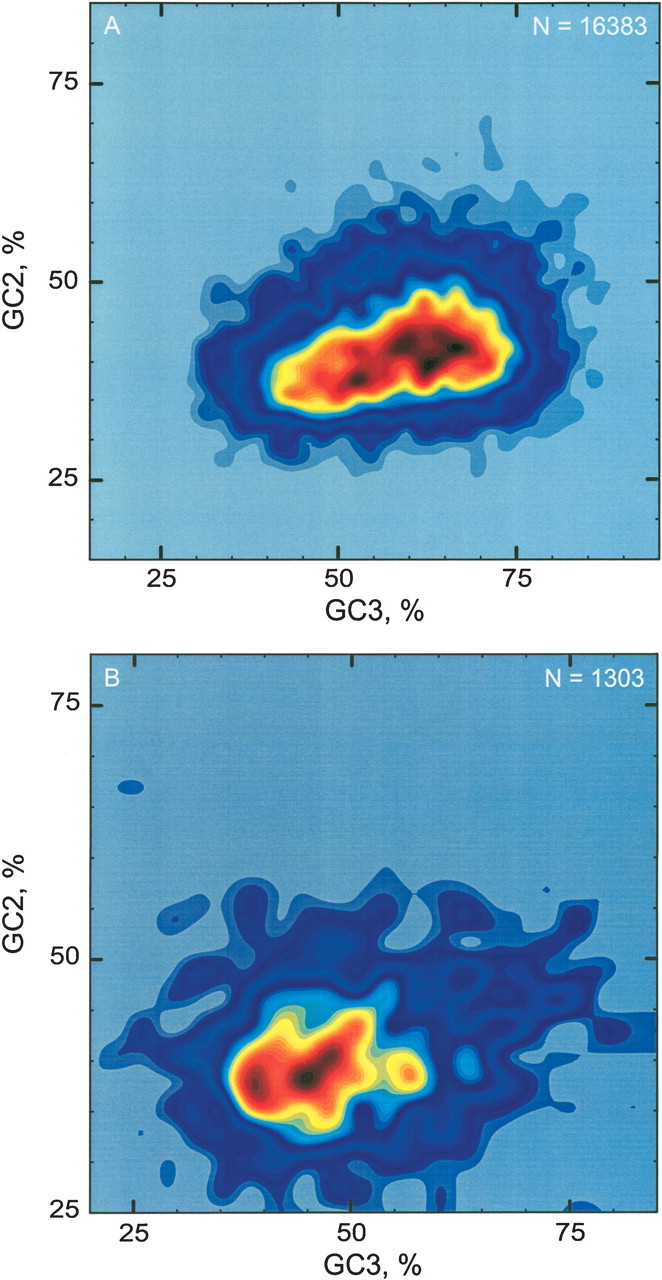
Figure 2
Frequency distributions of GC2 and GC3 values of mouse (A; 16,383 sequences) and Xenopus genes (B; 1303 sequences), represented as smoothed contour plots defining 3D compositional landscapes.
(Downloading may take up to 30 seconds. If the slide opens in your browser, select File -> Save As to save it.)
Click on image to view larger version.
Frequency distributions of GC2 and GC3 values of mouse (A; 16,383 sequences) and Xenopus genes (B; 1303 sequences), represented as smoothed contour plots defining 3D compositional landscapes.
 CiteULike
 Delicious
 Digg
Digg Facebook
 Google+
 Reddit
 Twitter
