
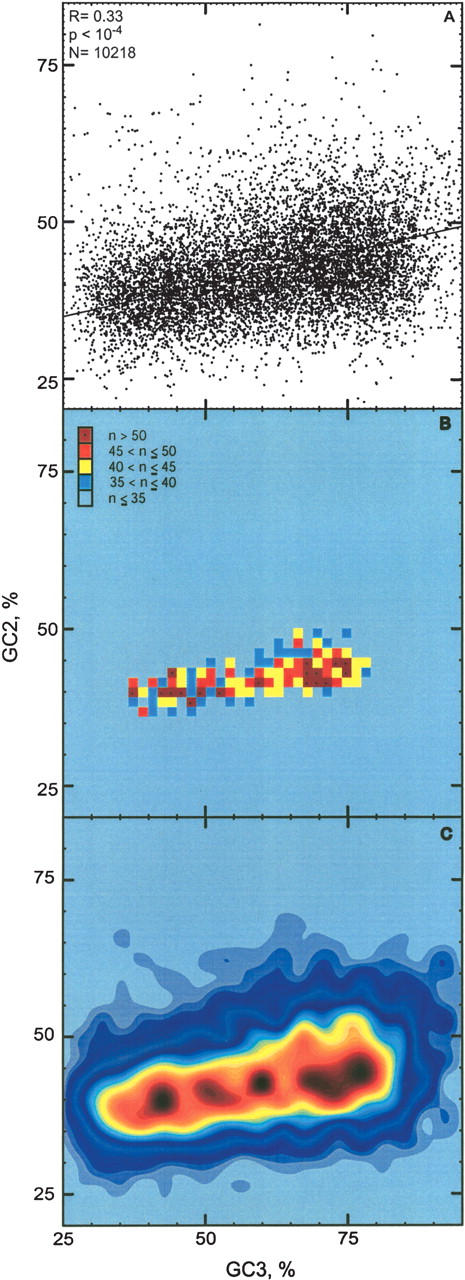
Figure 1
2D representations of the landscape of GC levels in second and third positions (GC2, GC3) of 10,218 curated human genes: (A) scatterplot, (B) bivariate histogram, and (C) smoothed contour plot. Bins were chosen to partition the range of GC2 and GC3 values found (minimum to maximum values) into 37 × 37 (B) or 21 × 21 (C) equal bins. Height (i.e., frequency) ranges are indicated by colors.


