
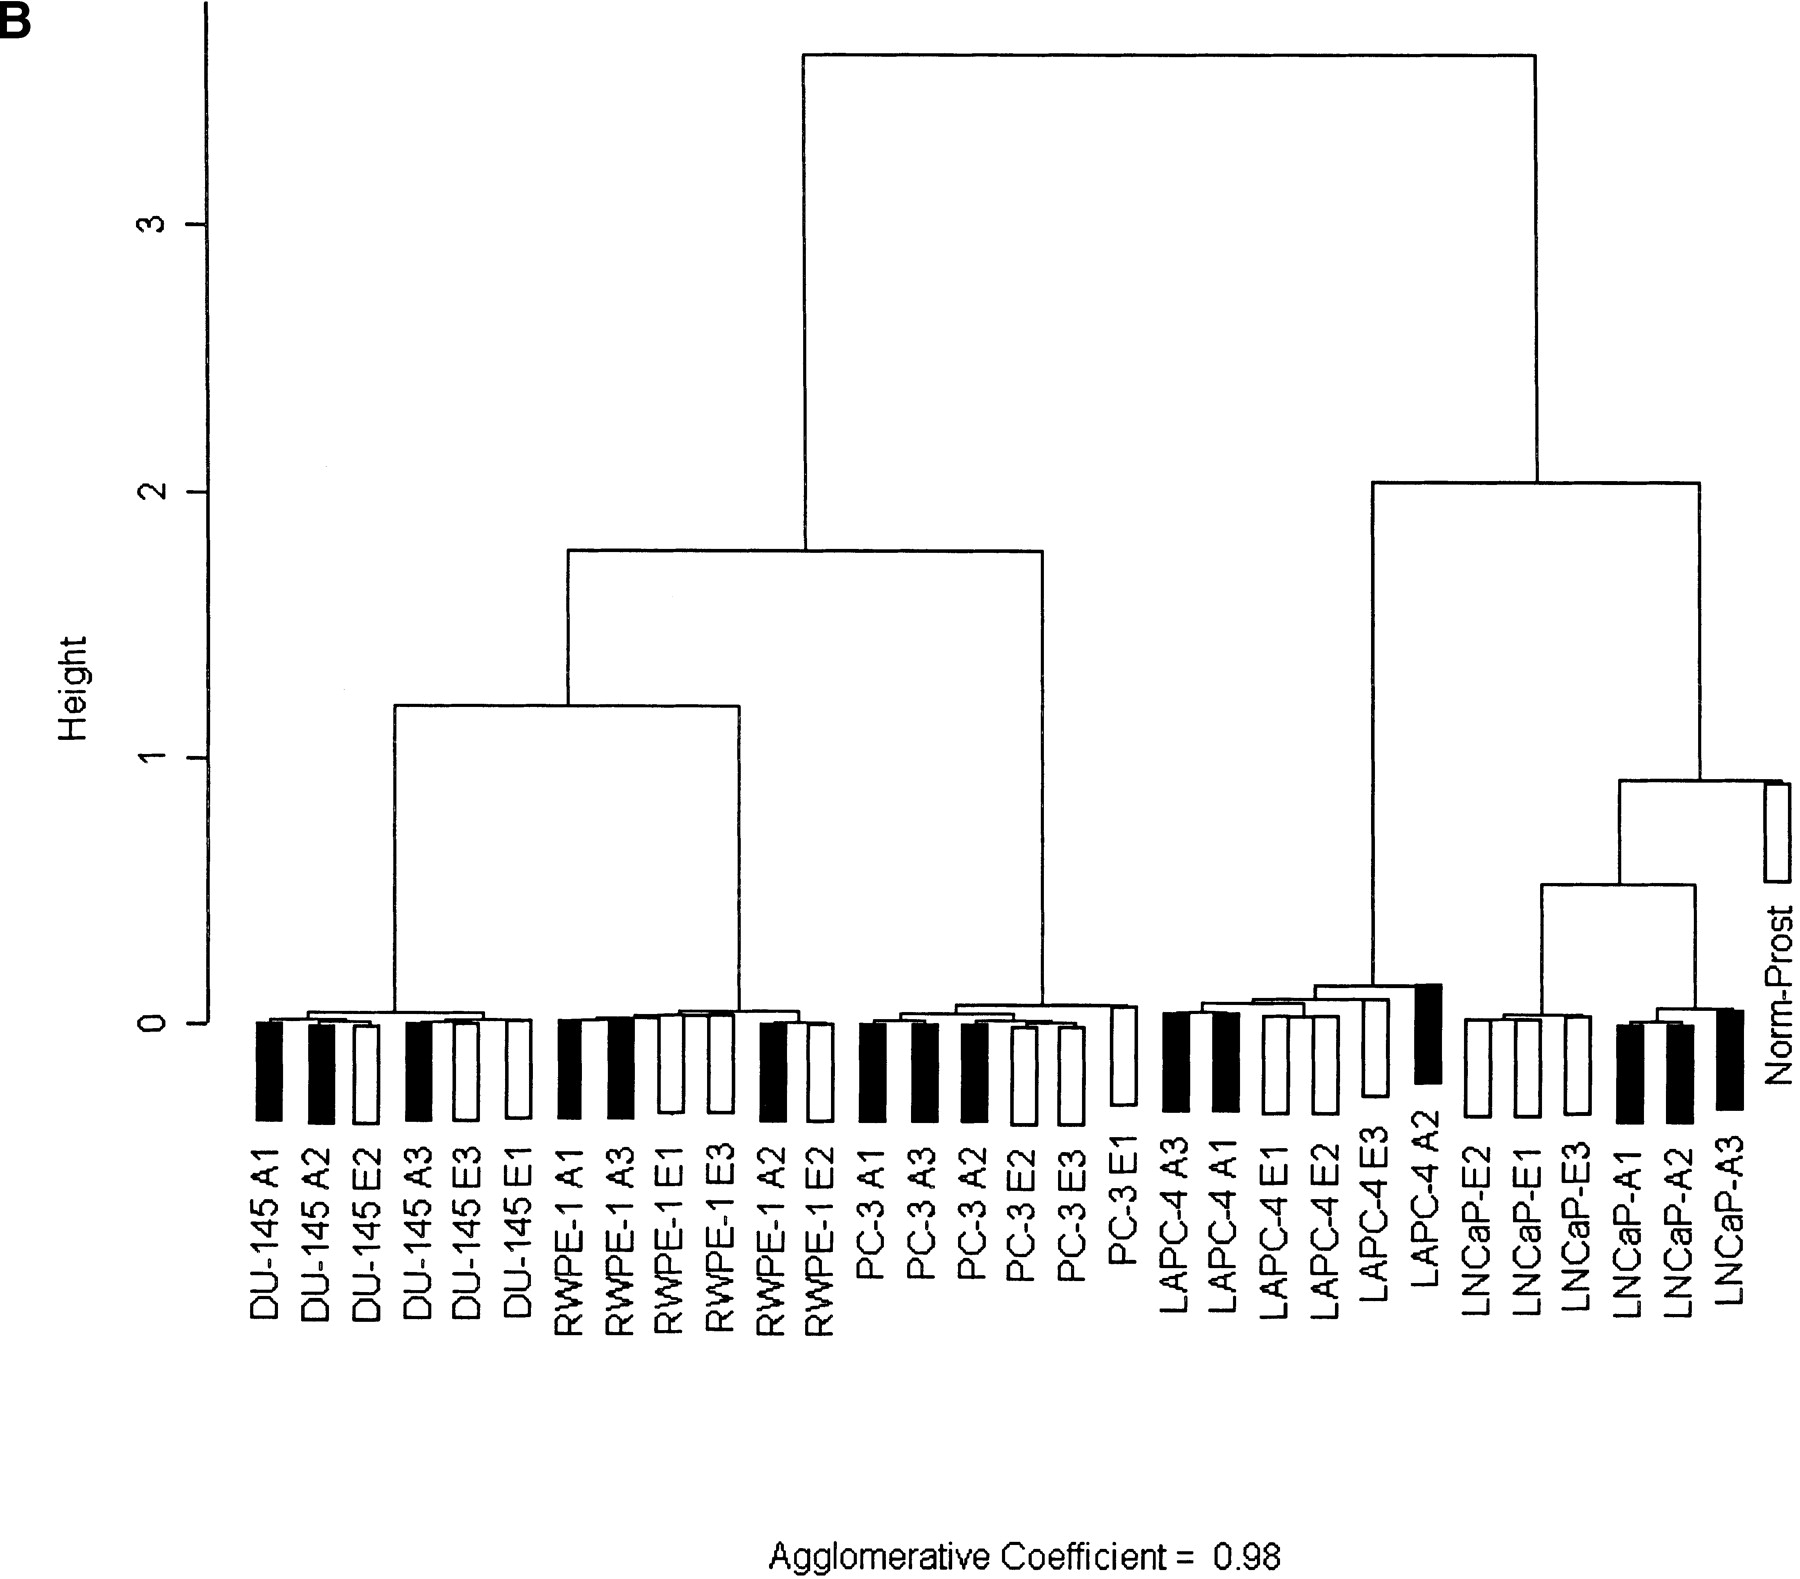
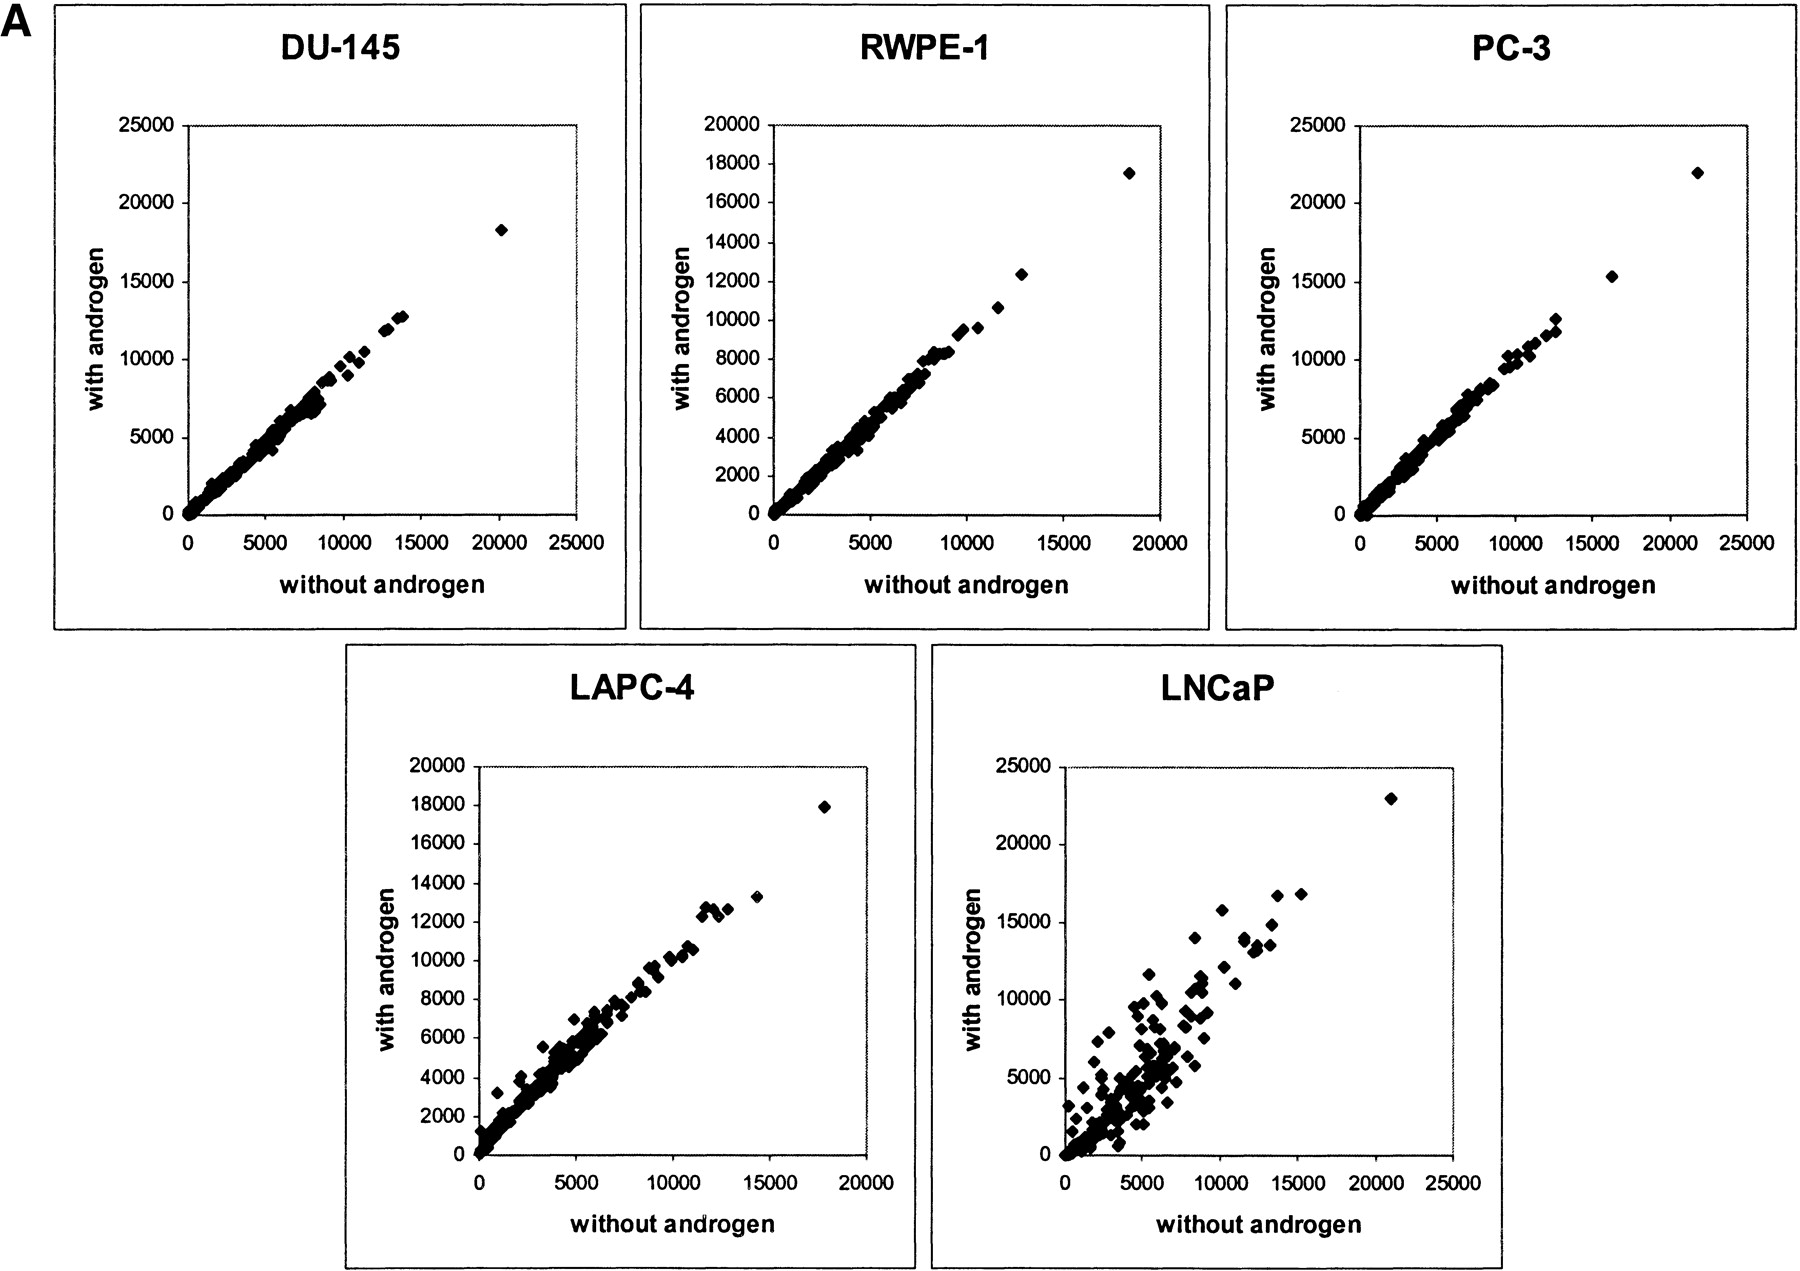
Figure 4
Cell-specific responses to androgen treatment. (A) Expression of 212 human prostate-related genes was monitored in prostate cell lines treated with androgen or vehicle. Data for each condition were plotted to illustrate the impact of treatment with androgen (y-axis) vs. vehicle (x-axis). (B) Agglomerative clustering using data from the 212 genes. For each cell line, three randomly selected biological replicates are presented for both androgen-treated (filled box) and untreated (open box) conditions. The distance between subclusters (y-axis, the height) measures the divergence of their expression patterns.


