
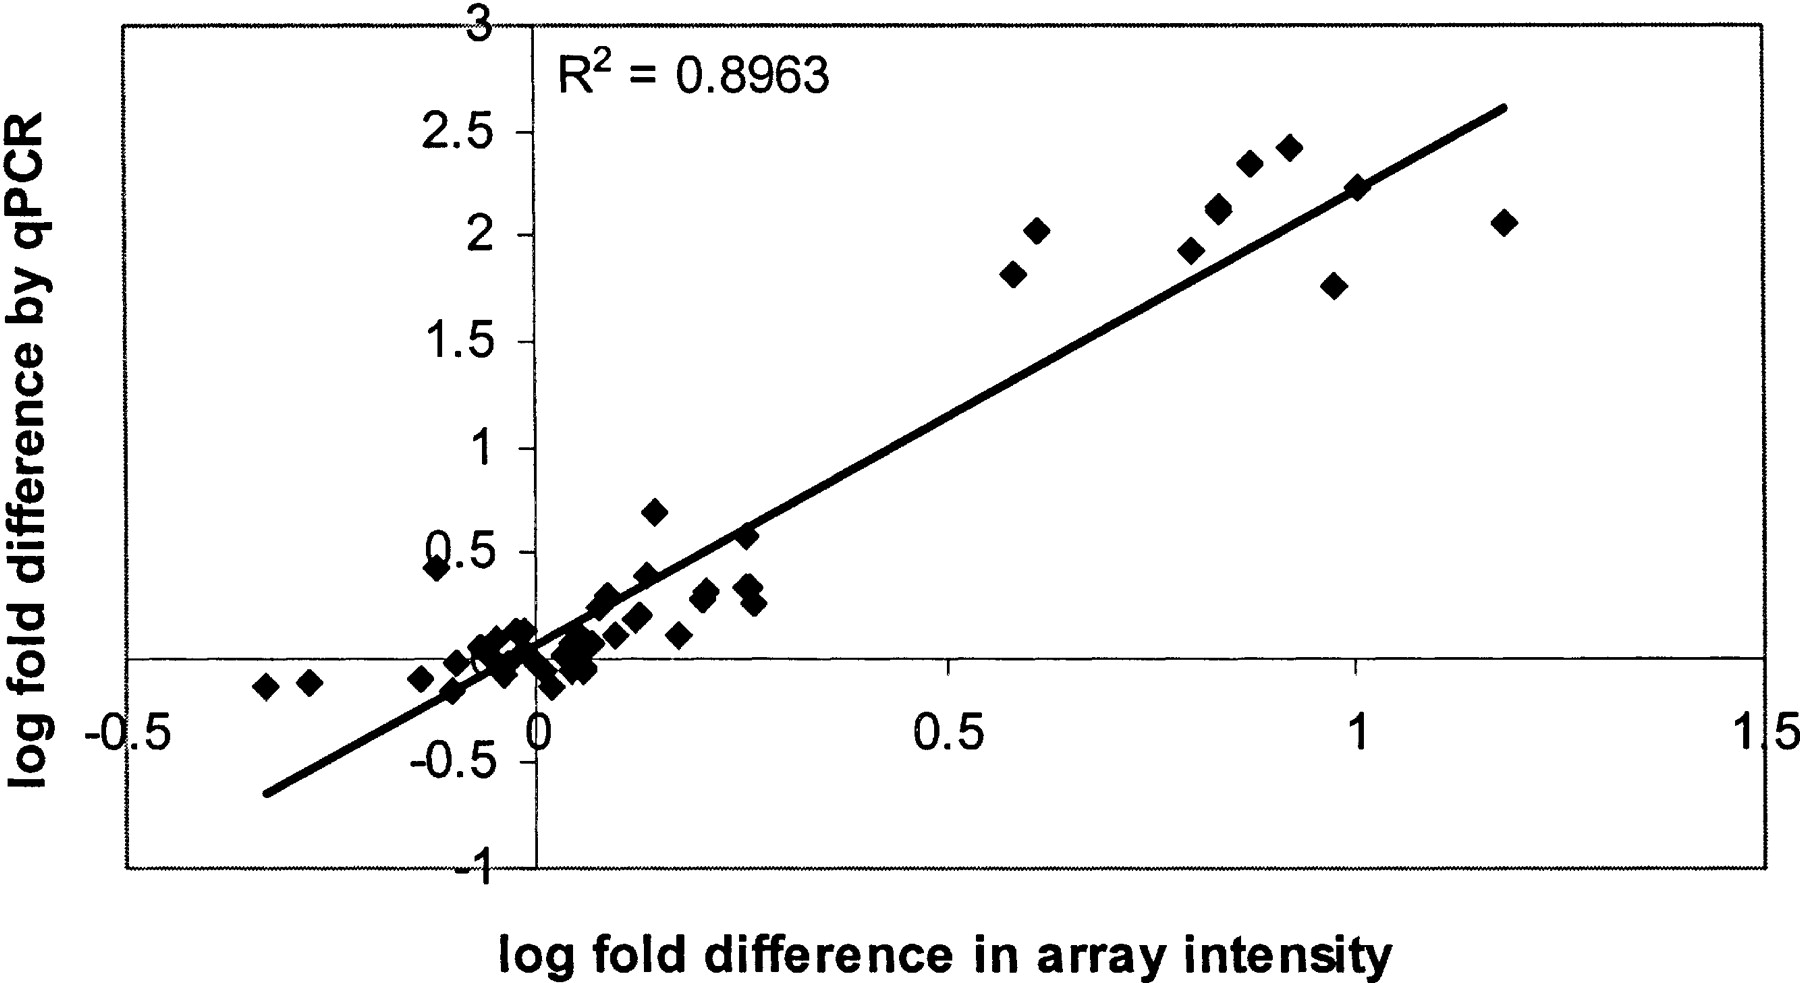
Figure 3
Correlation of DASL with qRT–PCR. The logarithmic fold difference in abundance in pairwise comparisons between A-20, EL-4, and a 1: 1 mix of the two was estimated for expressed genes in both the DASL assay (fold difference in array intensity, x-axis) and qRT–PCR (fold difference in abundance derived from crossover threshold, y-axis).


