
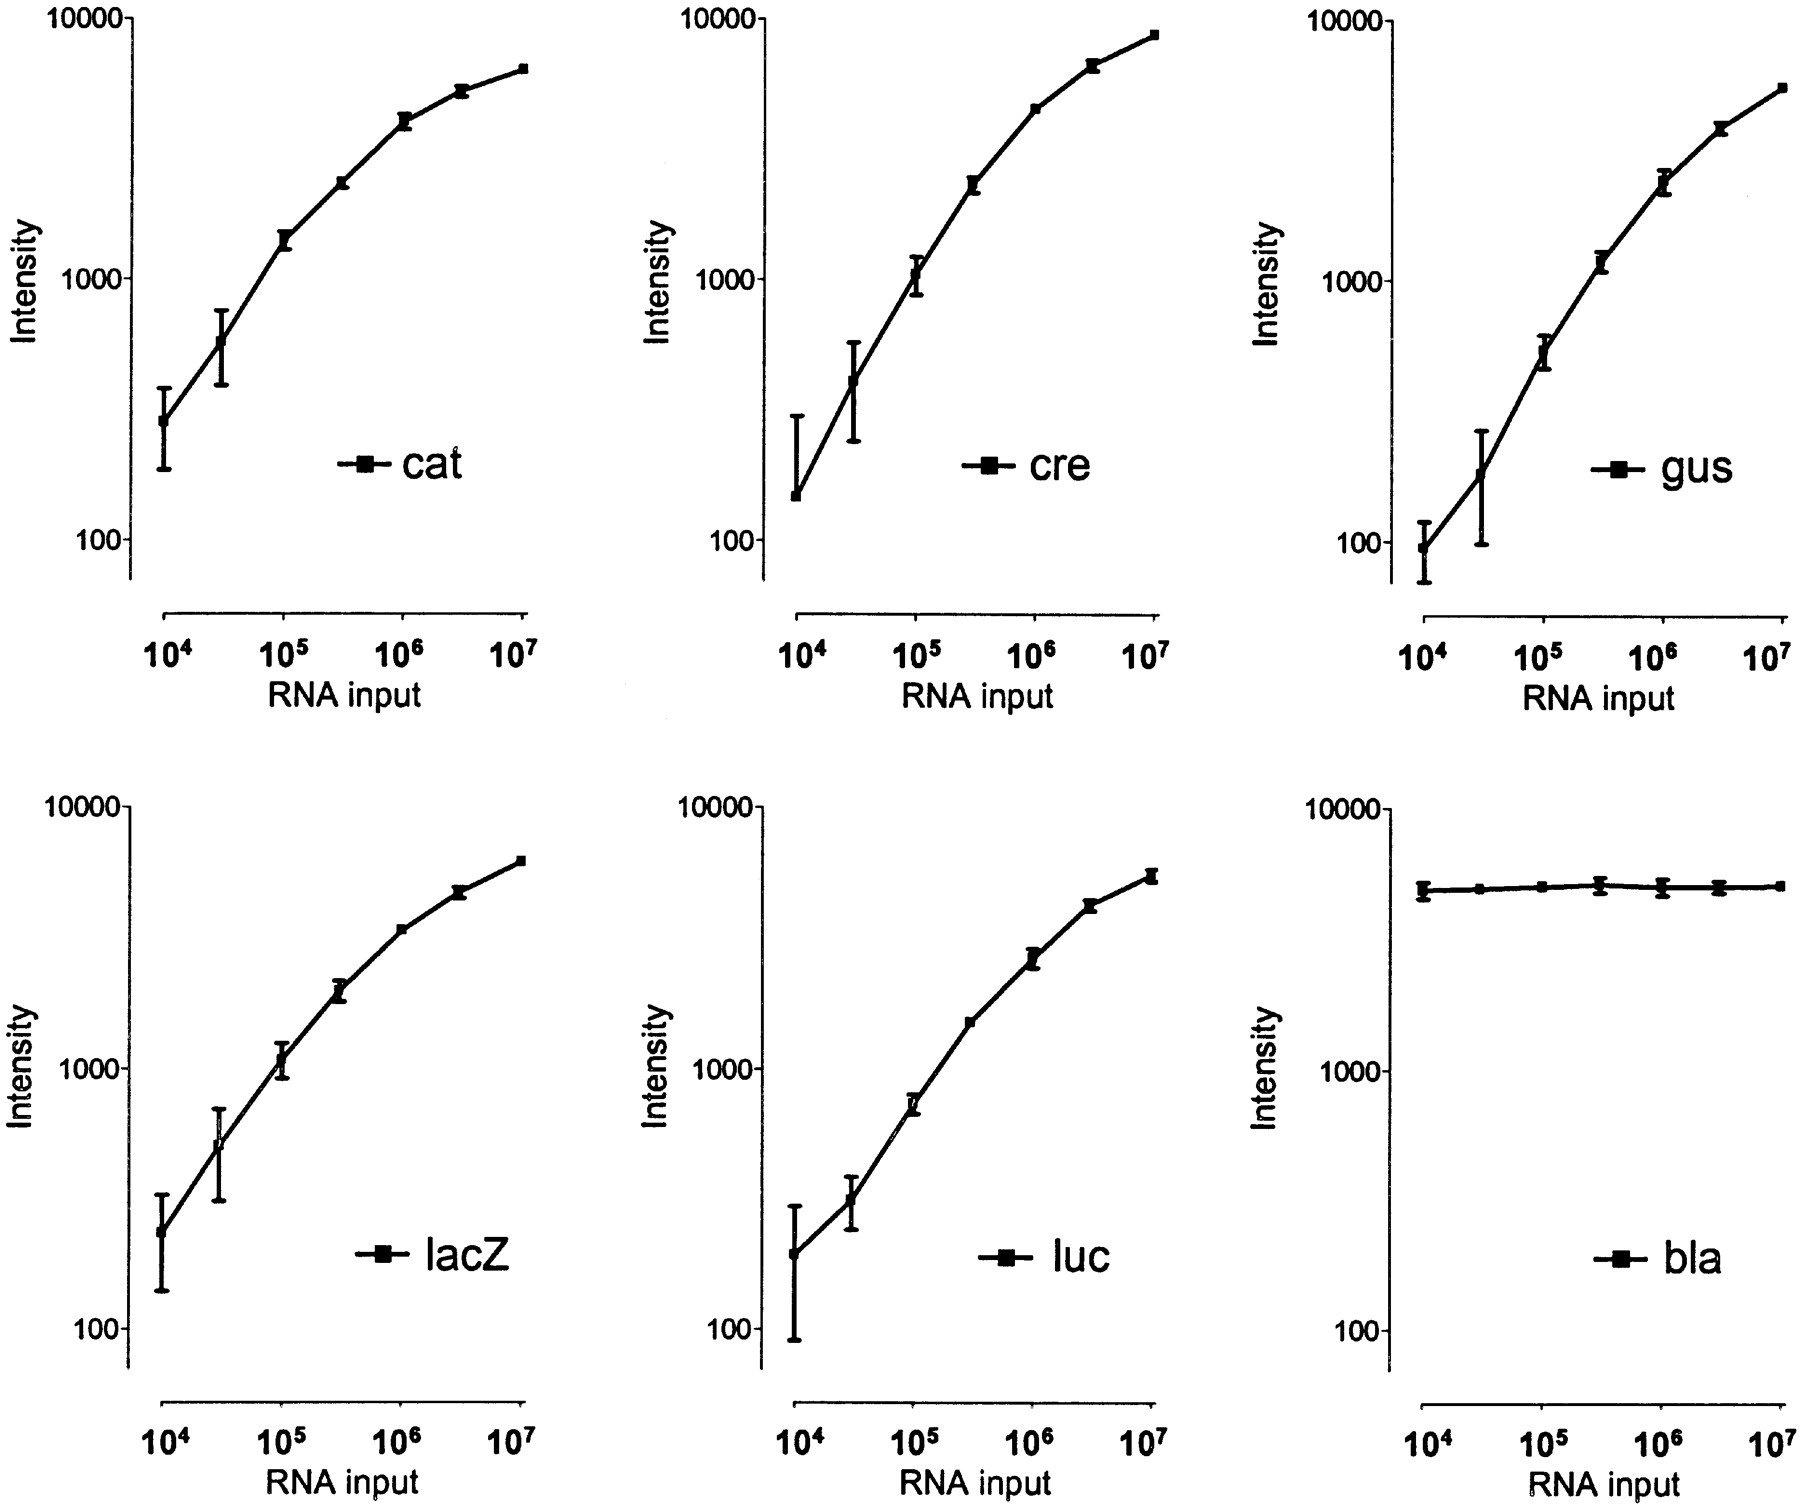
Figure 2
DASL assay performance, dynamic range and differential expression detection. Intensity data from six synthetic RNAs (cat, cre, gus, lacZ, luc, and bla) are shown as log intensity vs. log RNA input (molecules) in the DASL assay. The RNA input is given as molecules of spiked transcript per DASL reaction. The error bars represent the 95% confidence interval of intensity values for six replicate assays.


