
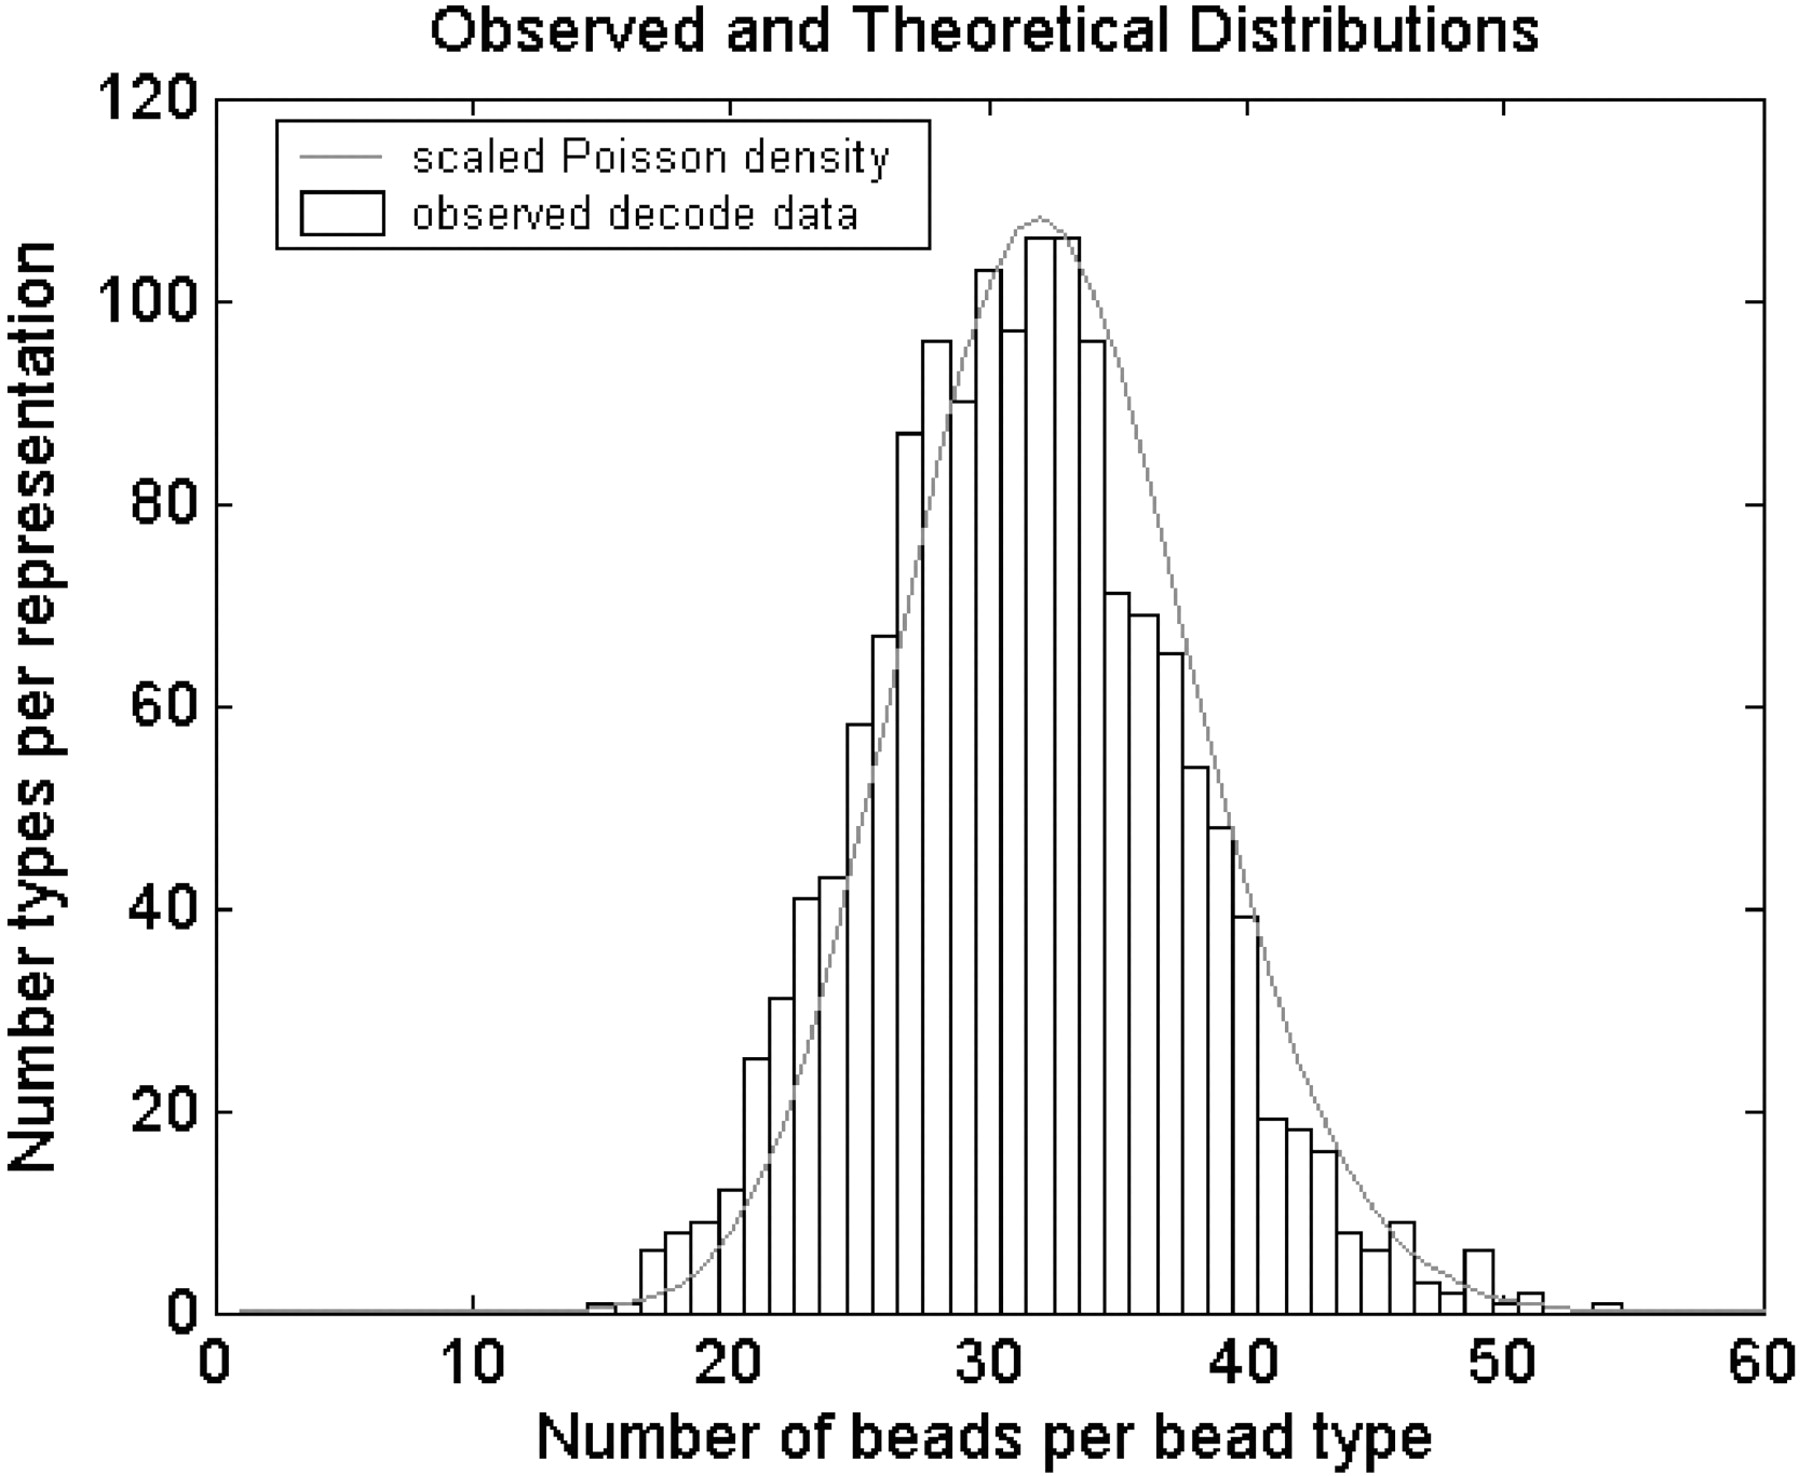
Bead representation histogram from a representative decoded array overlaid with a scaled Poisson density function. The loading of each array is a sampling of beads from a near infinite bead pool. Almost N ∼ 50,000 beads are sampled, and the probability, p, that a sampled bead belongs to a particular type is approximately one divided by the number of bead types. Because N is large, p is small, and the initial bead pool is near infinite, the number of beads from each bead type is well modeled by a Poisson distribution with mean Np. With 1520 bead types, we average >30 replicate beads per bead type, and the probability that any bead type has fewer than five replicate beads is extremely low (∼5.5 × 10⁻⁶).


