
Figure 2
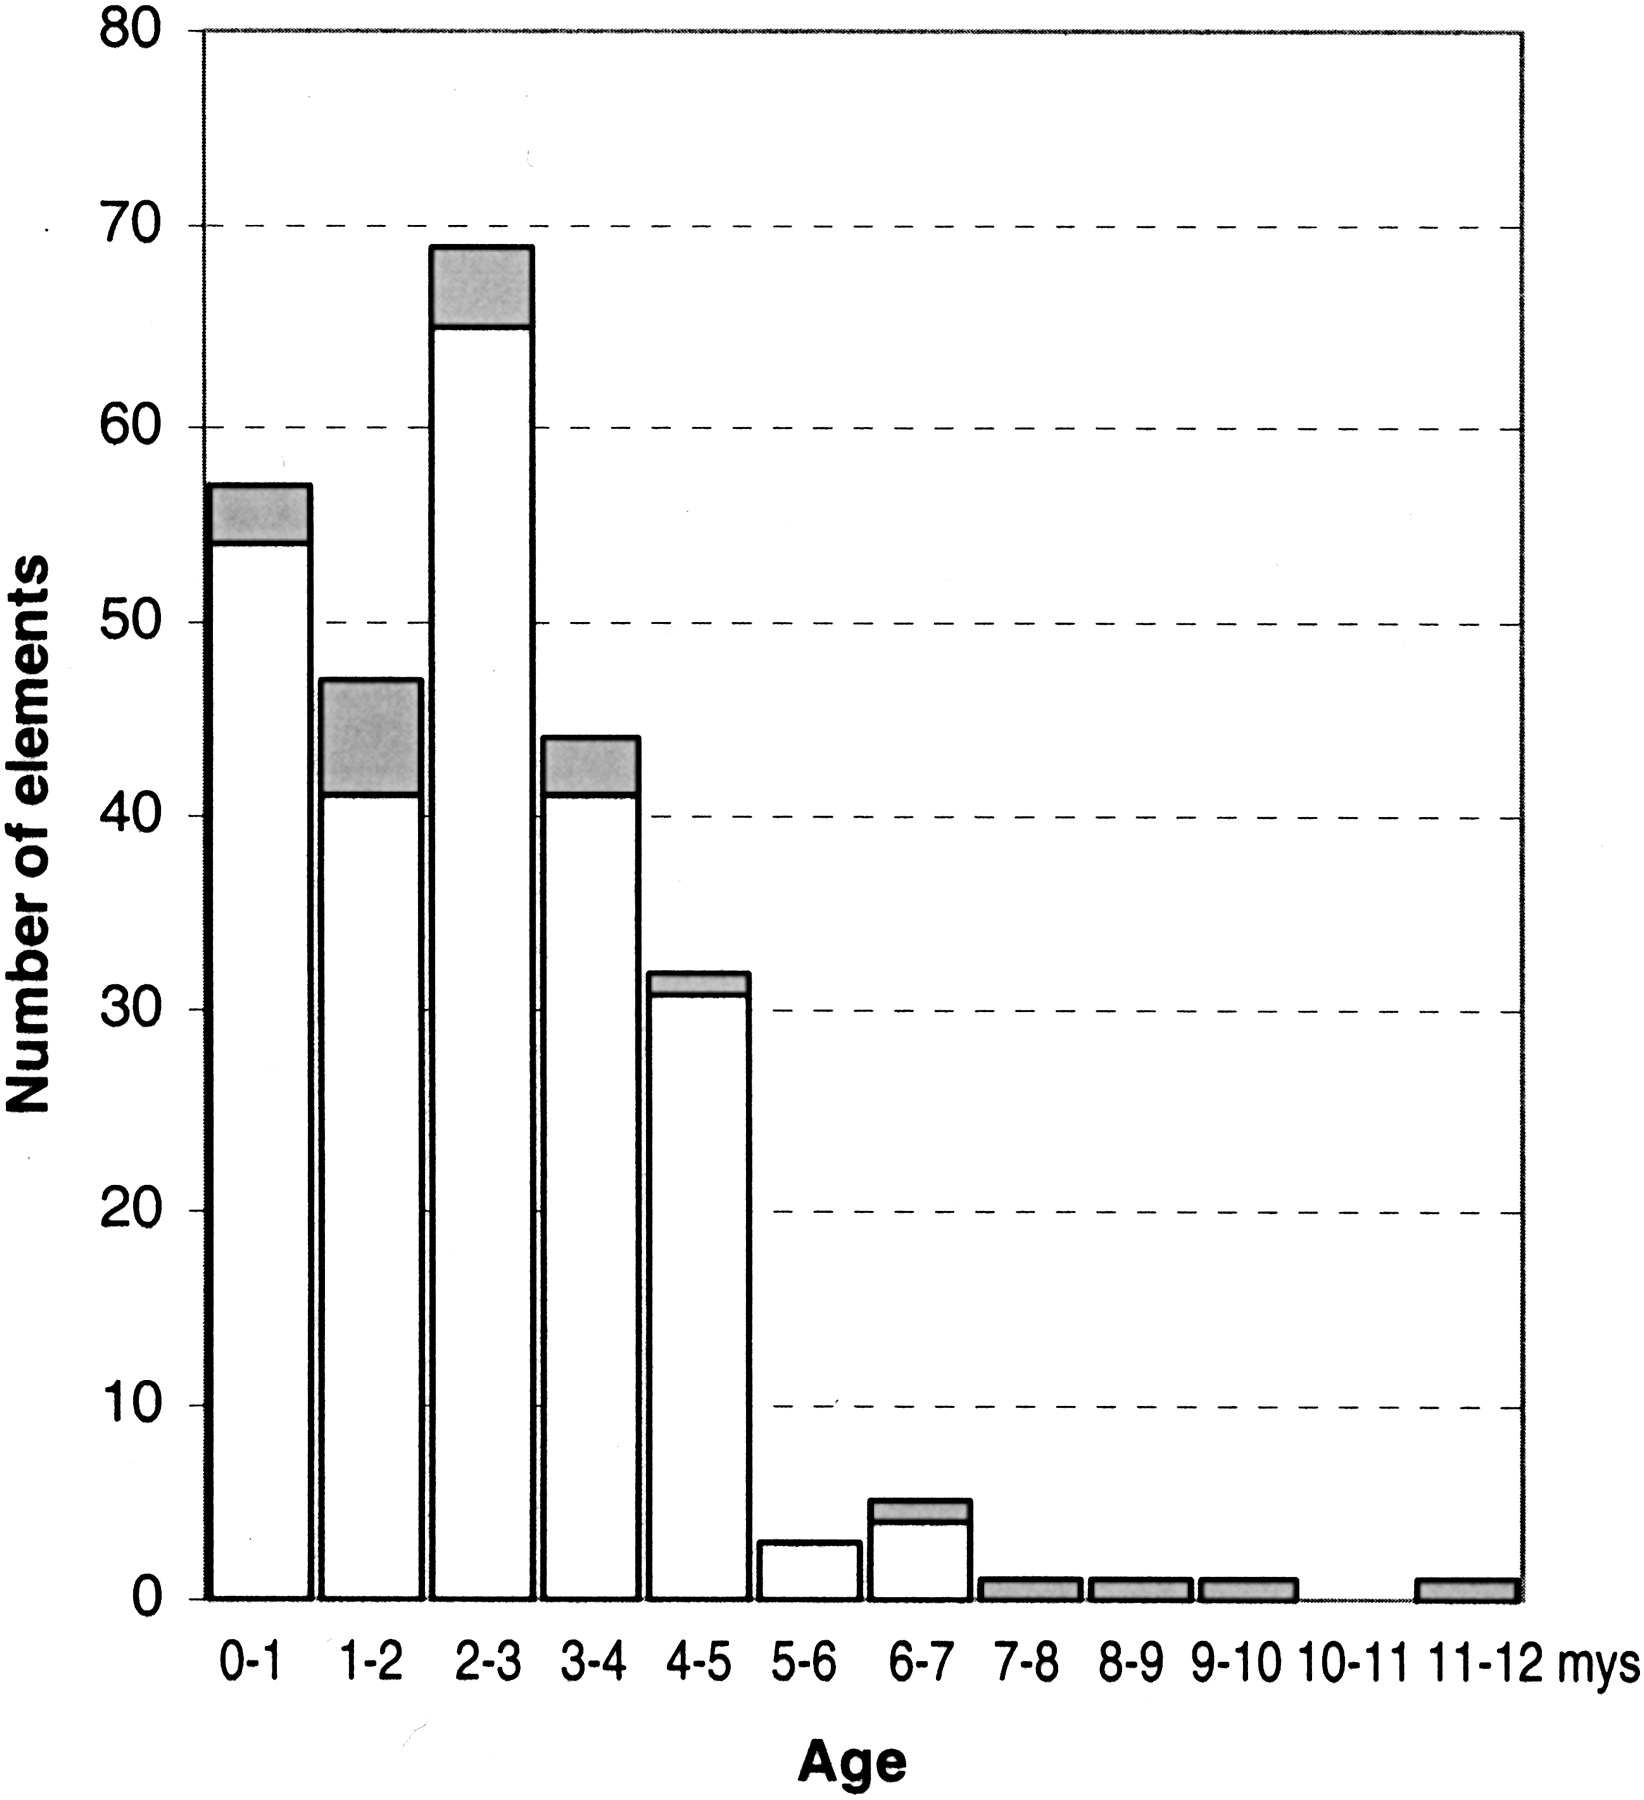
Distribution of ages of LTR retrotransposons in rice. Open bars show intact elements. Gray bars show elements with partially deleted LTRs. (mys) Million years.
(Downloading may take up to 30 seconds. If the slide opens in your browser, select File -> Save As to save it.)
Click on image to view larger version.
Distribution of ages of LTR retrotransposons in rice. Open bars show intact elements. Gray bars show elements with partially deleted LTRs. (mys) Million years.
 CiteULike
 Delicious
 Digg
Digg Facebook
 Google+
 Reddit
 Twitter
