
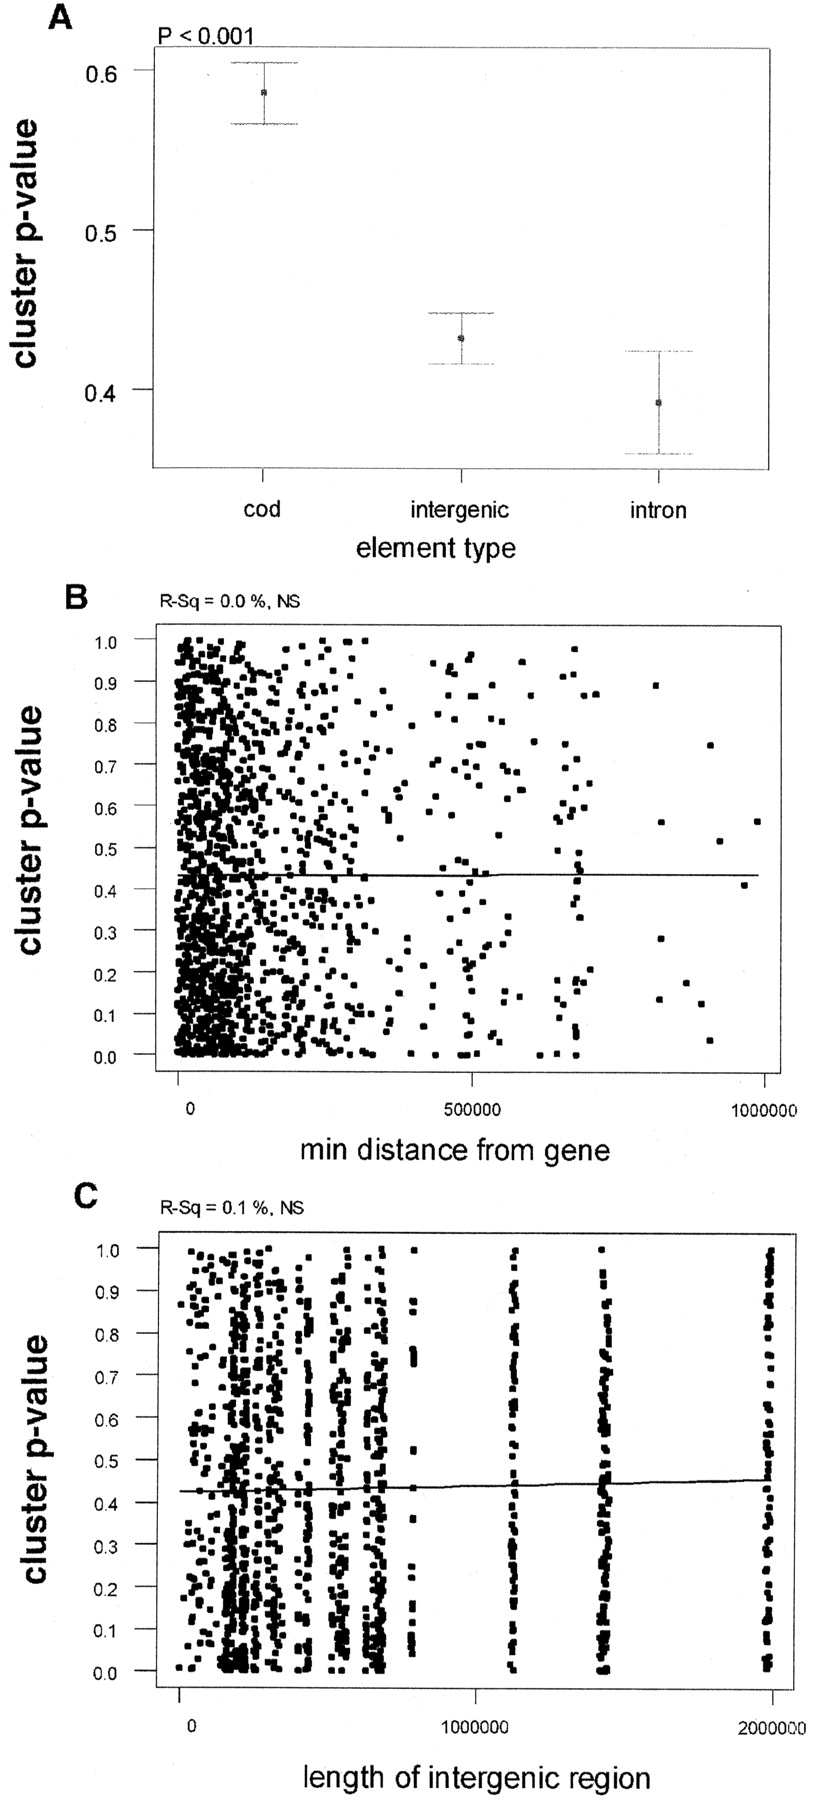
Figure 5
(A) Confidence intervals of clustering P-values for CODs, intergenic CNGs, and intronic CNGs. (B,C) Regression of clustering P-values with distance of CNG from nearest gene (B) and length of intergenic region (C). Regression lines are indicative. P-values and R-squared values are at the top of the graph.


