
Figure 4
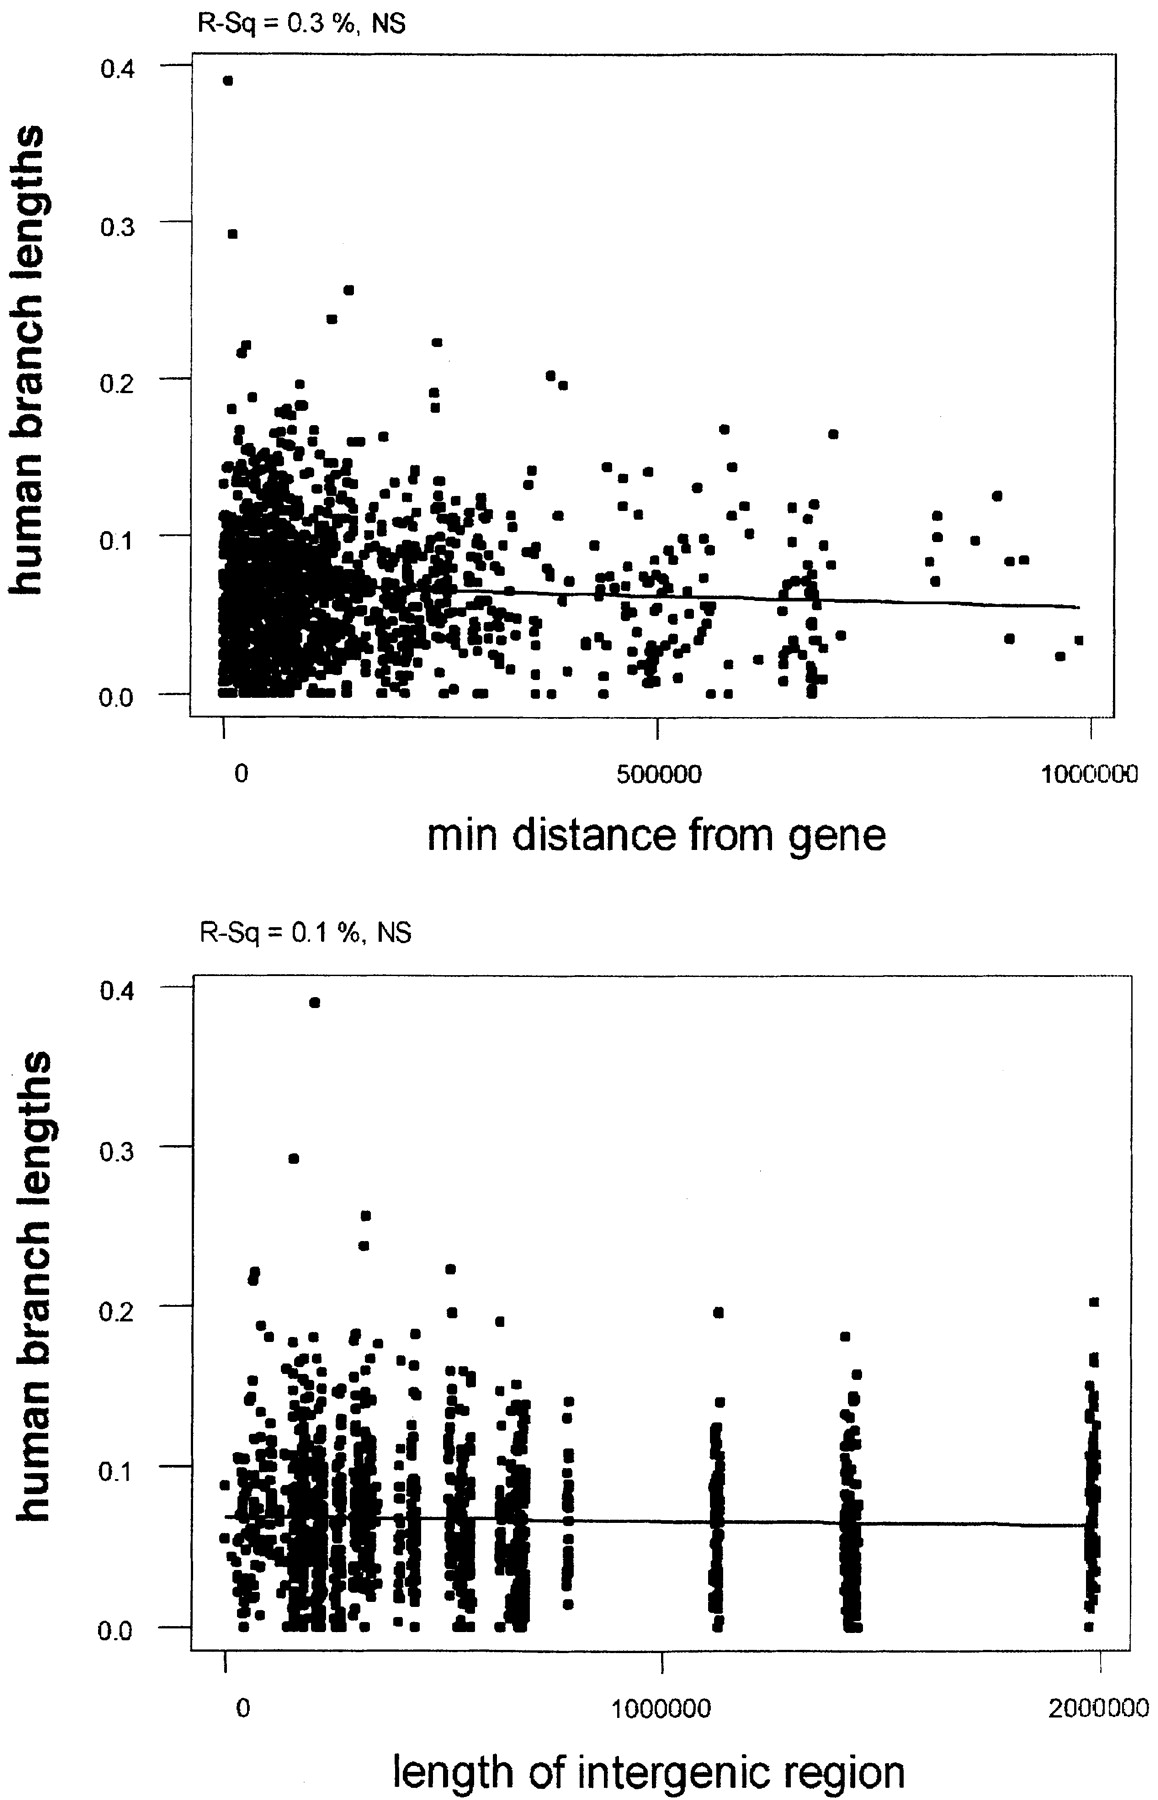
Regression of human branch lengths with the distance from the nearest gene (A) and length of intergenic region (B). Regression lines are indicative. P-values and R-squared values are at the top of the graph.
(Downloading may take up to 30 seconds. If the slide opens in your browser, select File -> Save As to save it.)
Click on image to view larger version.
Regression of human branch lengths with the distance from the nearest gene (A) and length of intergenic region (B). Regression lines are indicative. P-values and R-squared values are at the top of the graph.
 CiteULike
 Delicious
 Digg
Digg Facebook
 Google+
 Reddit
 Twitter
