
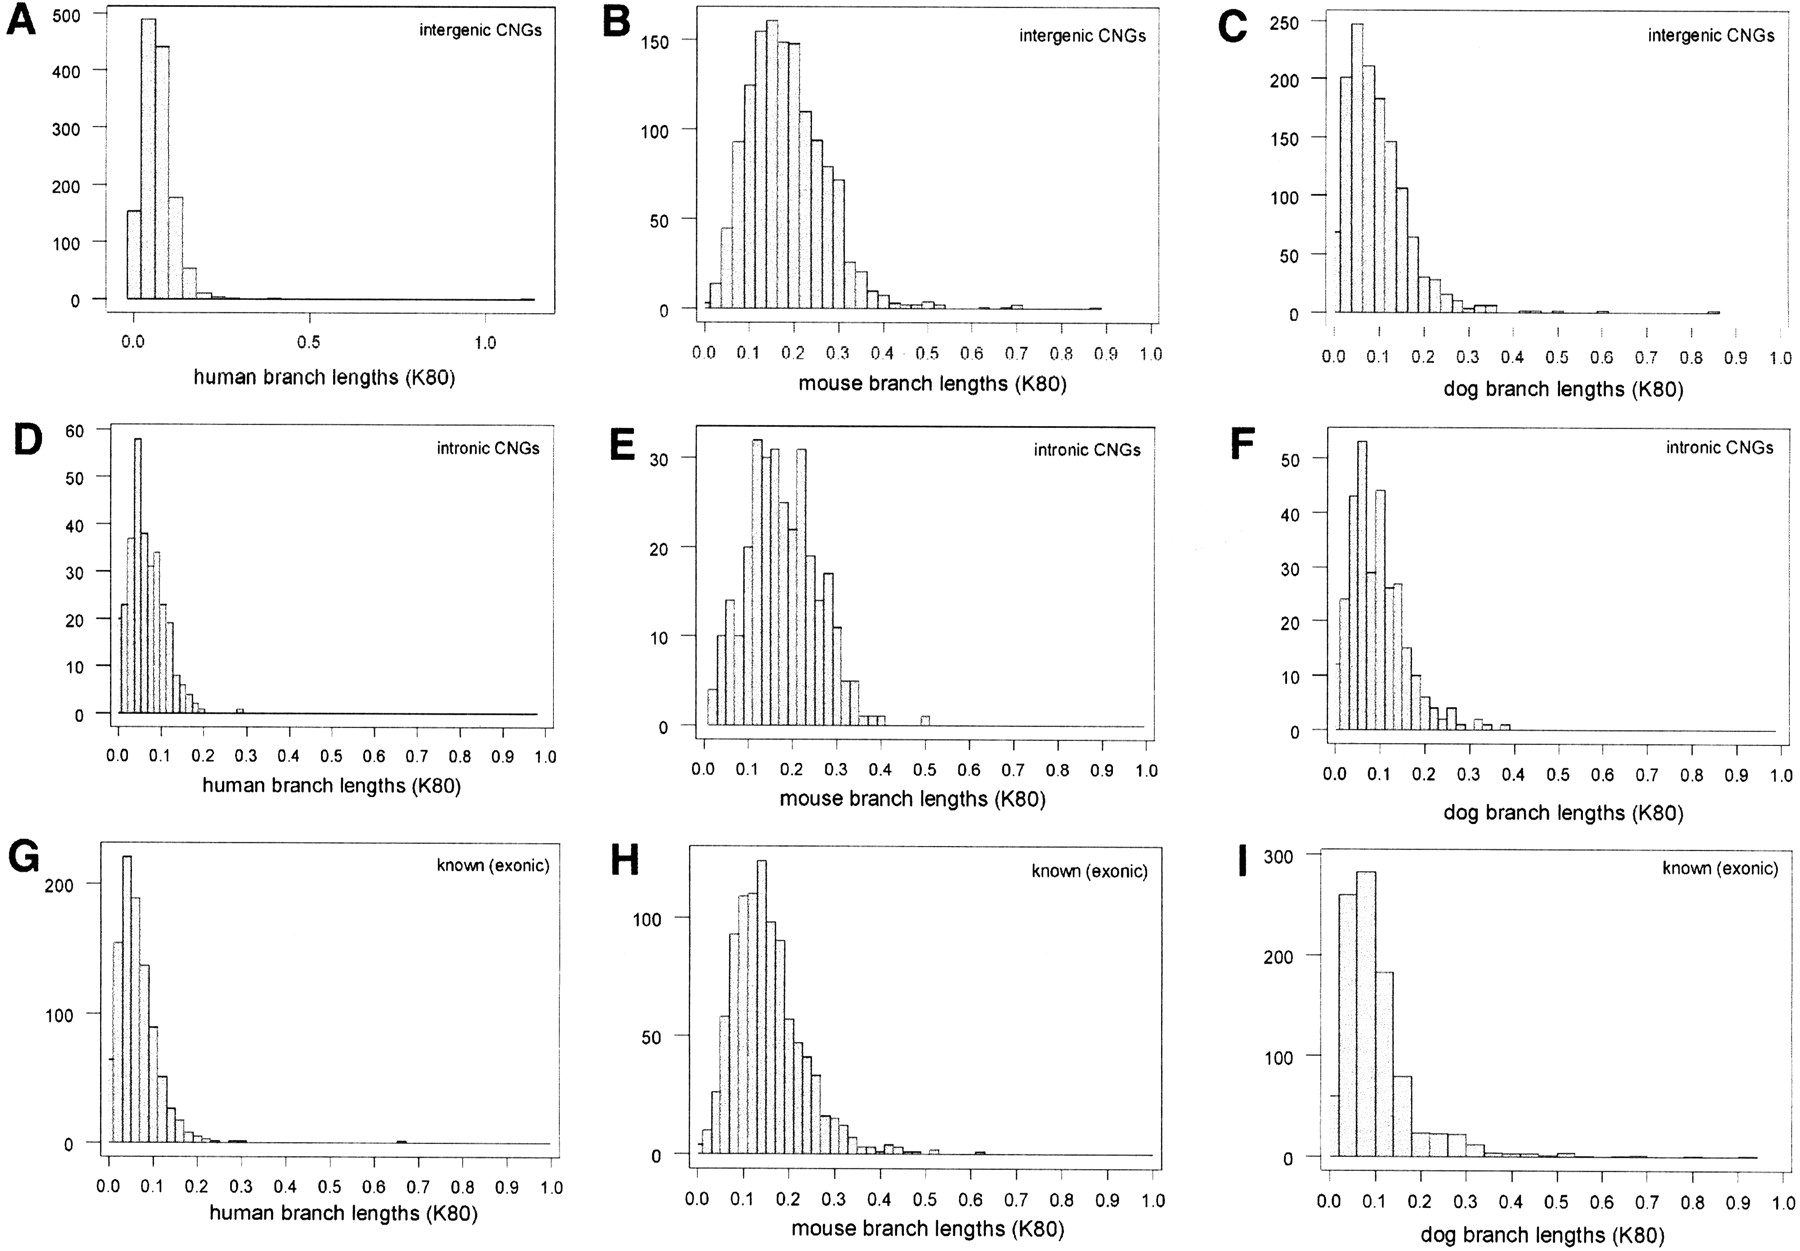
Figure 1
Distributions of human, mouse, and dog branch lengths using the K80 estimate of divergence for intergenic CNGs (A,B,C), intronic CNGs (D,E,F), and CODs (exonic; G,H,I). The y-axes indicate the number of sequences (frequency).


