
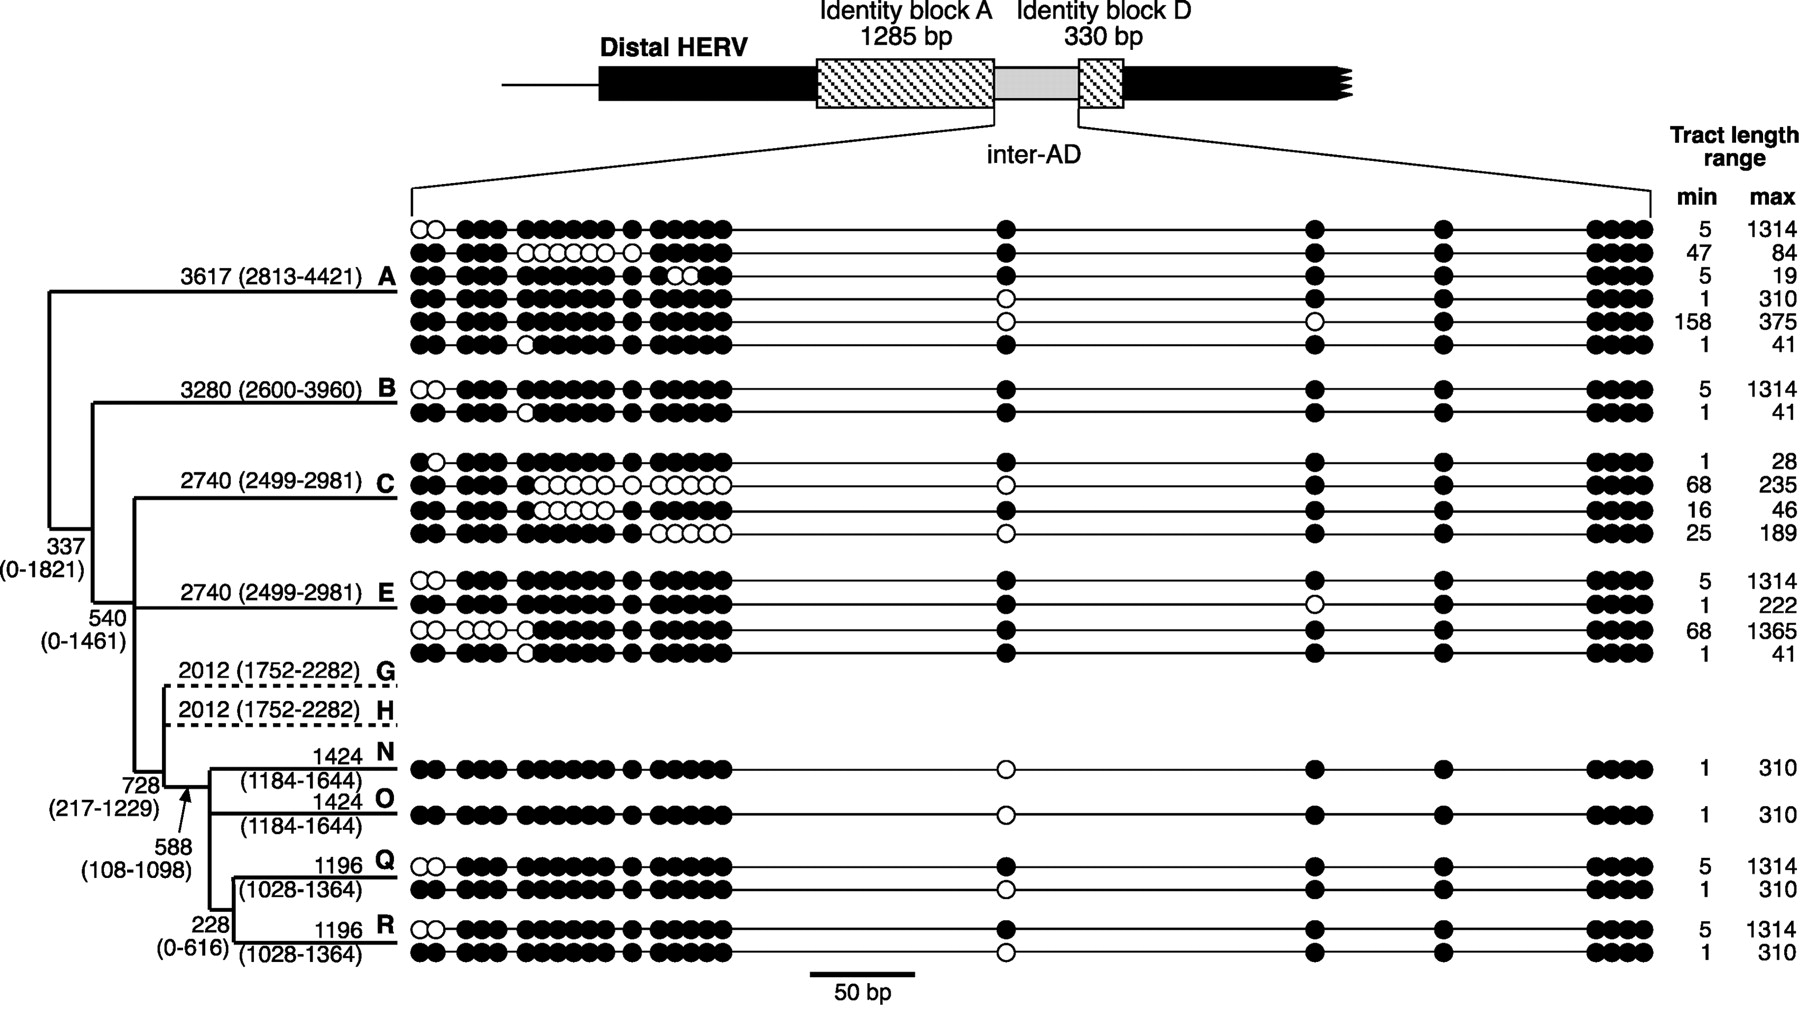
Number of independent proximal-to-distal conversion events within the sample. Sequence states of the PSVs within the distal inter-AD segment are shown schematically as small filled or empty circles and are defined as proximal or distal specific according to the reference sequence; spacing is approximately to scale. Each horizontal line represents one independent event, as deduced from the sequences shown in Fig. 2. The phylogeny to the left shows the haplogroup within which each event occurred and, adjacent to branches, the estimated age in generations (and its range as ±SD) of each branch, taken from published dates (Hammer and Zegura 2002) and assuming a generation time of 25 years. Branches G and H are included, even though they contain no conversions, because their ages are required in the rate calculation. Branches D and J are omitted because their lack of PSVs makes them uninformative.


